
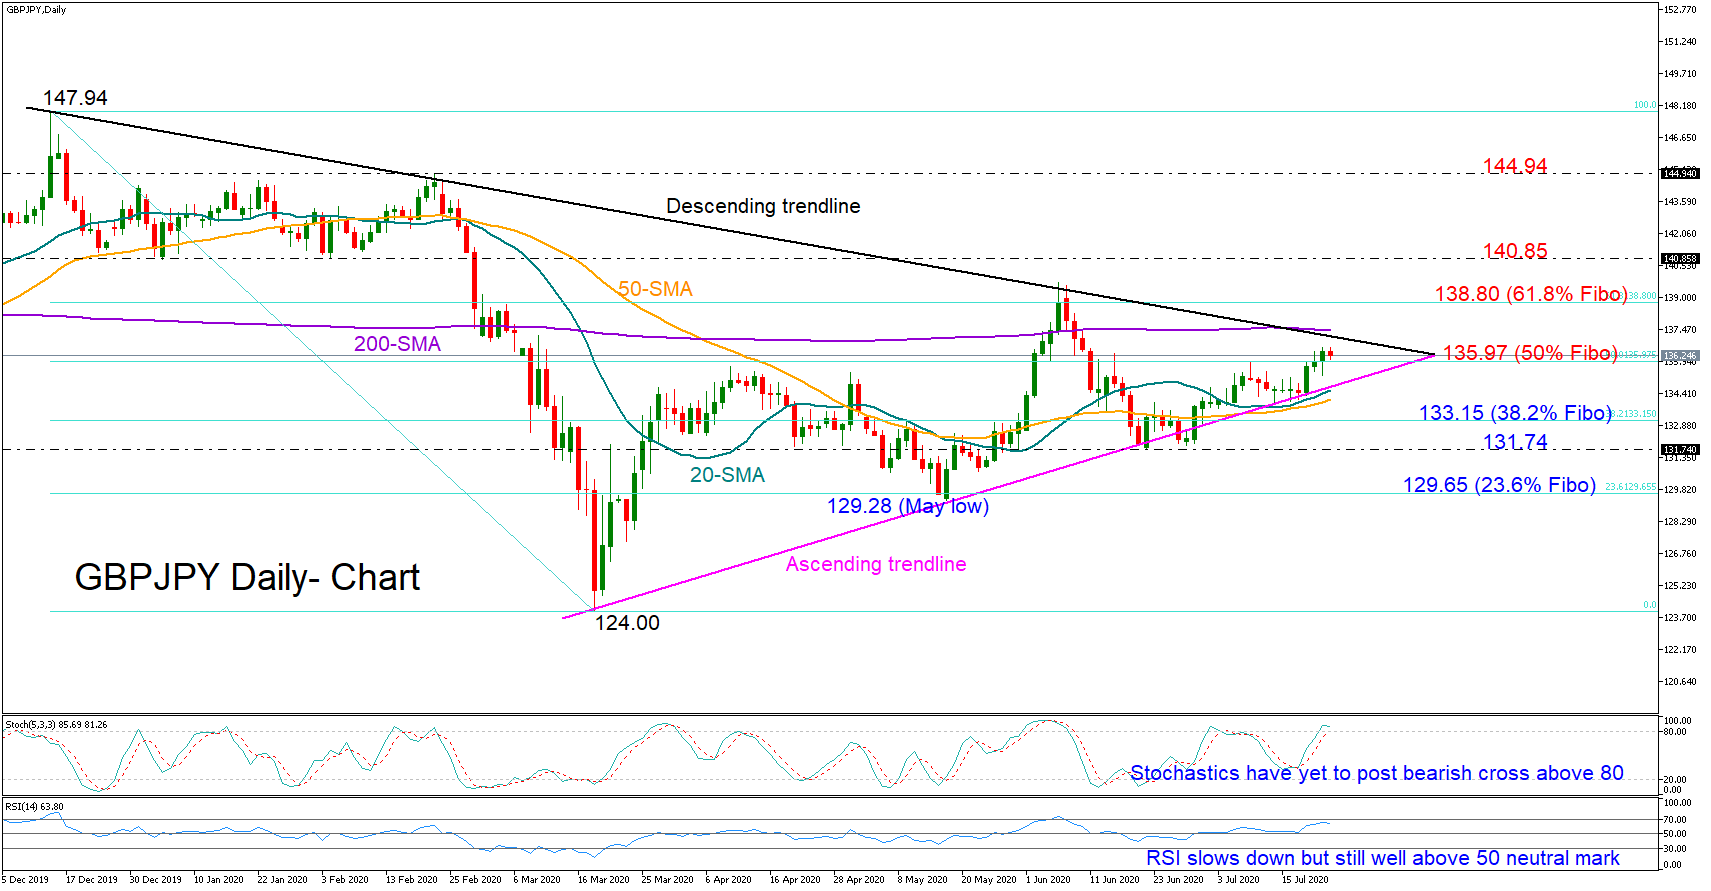
GBPJPY curved up near the 20-day simple moving average (SMA) and the lower line of a big symmetrical triangle and towards a 6-week high of 136.60.
The price also managed to close slightly above the 50% Fibonacci retracement level of the 147.94-124.00 downleg on Wednesday, increasing the odds for another upturn. However, the upper part of the triangle is only a short distance away and with the help of the 200-day SMA near 137.38 it could damper any bullish actions. In case it fails to do so, the 61.8% Fibonacci of 138.80 may come to the rescue, deterring any upside moves towards the 140.85 former support area. Higher, the next stop could be around 144.94.
According to the RSI and the Stochastics the short-term bias is still positive as the indicators have yet to confirm overbought conditions. A decisive downside reversal below the 20-day SMA, however, could eliminate buying confidence, especially if the 38.2% Fibonacci of 133.15 proves an easy obstacle to overcome. Then, support could run again towards the 131.74 swing low, a break of which may trigger a steeper decline towards the 23.6% Fibonacci of 129.65 and May’s trough of 129.28.
In brief, GBPJPY may extend its recent rebound in the short-term, though whether the pair can run above the symmetrical triangle remains to be seen.


