
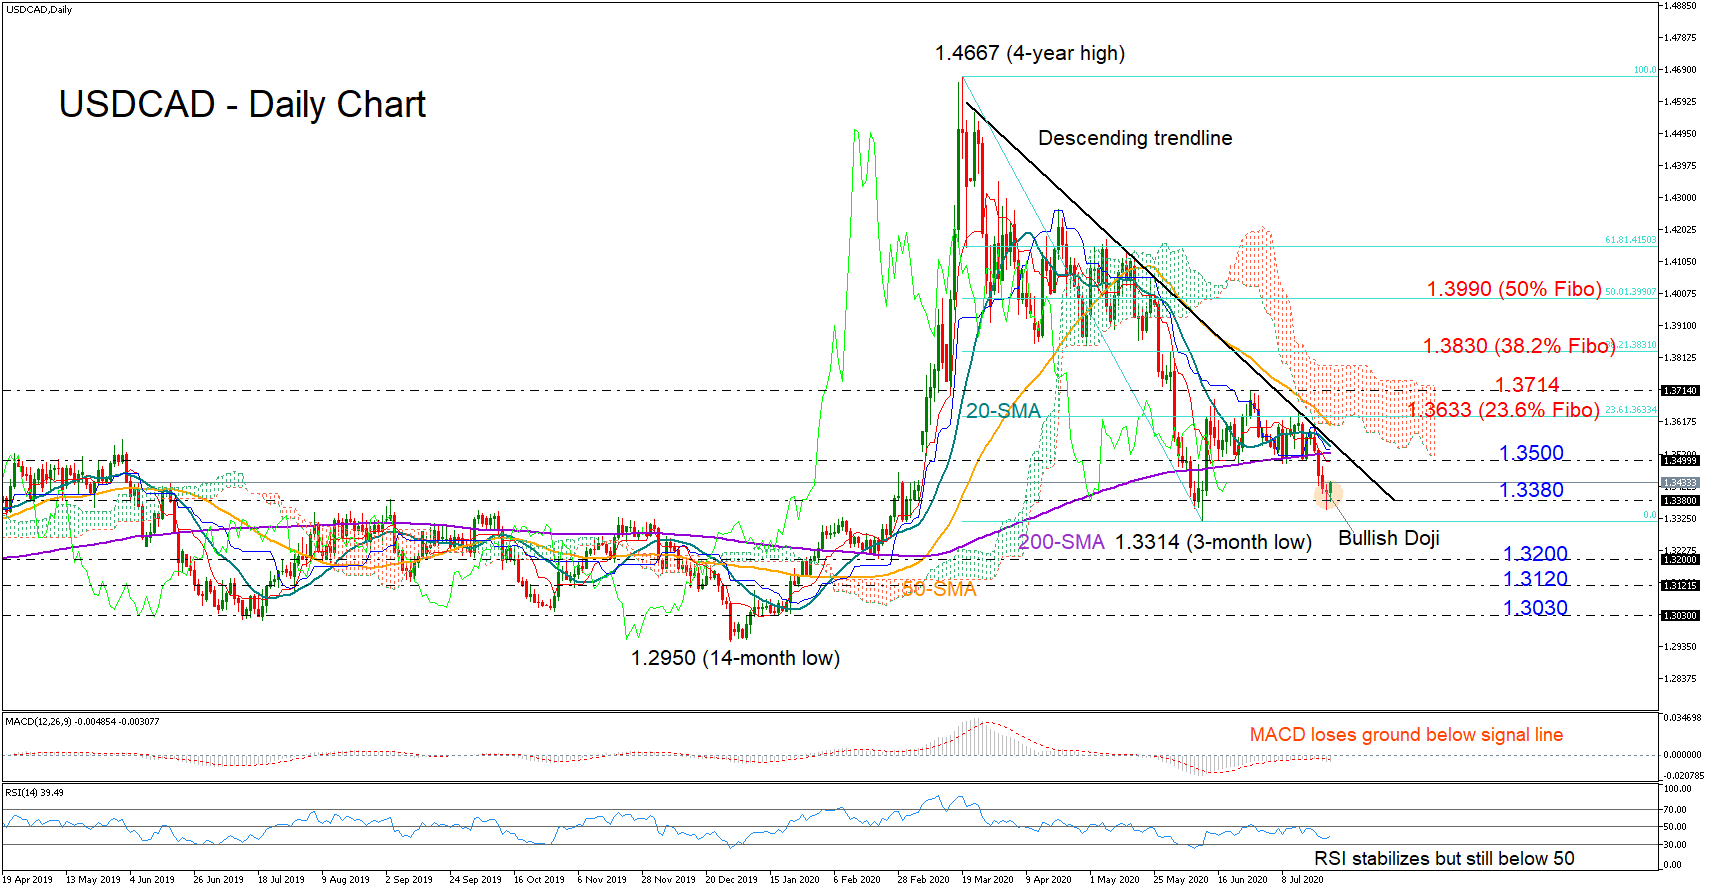
USDCAD was forced to shift south after the descending trendline and the 23.6% Fibonacci level of the 1.4667-1.3314 downleg held firm once again, with the price tumbling as low as 1.3350 on Thursday.
The pair is currently consolidating its losses near the 1.3380 support area but the technical indicators suggest that the bears have not abandoned the sell-off yet; the MACD is strengthening to the downside and below its red signal line, while the RSI remains comfortably below its 50 neutral mark despite stabilizing a bit. A potential bearish cross between the 20- and 200-day simple moving averages (SMAs) could be another disappointing signal if completed.
Should the price retreat below 1.3380, the three-month low of 1.3314 could immediately come to the rescue. Breaching that base, the decline may get new legs towards the 1.3200 round level, while lower it could rest near the 1.3120 barrier before testing the 1.3030 support region.
Alternatively, if an upside reversal takes place near the 1.3380 mark, making Thursday’s bullish doji candle more reliable, the pair could push harder to clear the trendline within the 1.3500-1.3540 zone and crawl up to the 23.6% Fibonacci of 1.3633. A close above the swing high of 1.3714 would violate the downward pattern, boosting the price towards the 38.2% Fibonacci of 1.3830. In this case, the negative medium-term outlook would switch to neutral.
Summarizing, the short-term bias for USDCAD is currently viewed as negative and a close below 1.3380 could confirm that. A negative outlook is also likely to stay in place in the medium-term picture unless the price jumps above 1.3715.


