
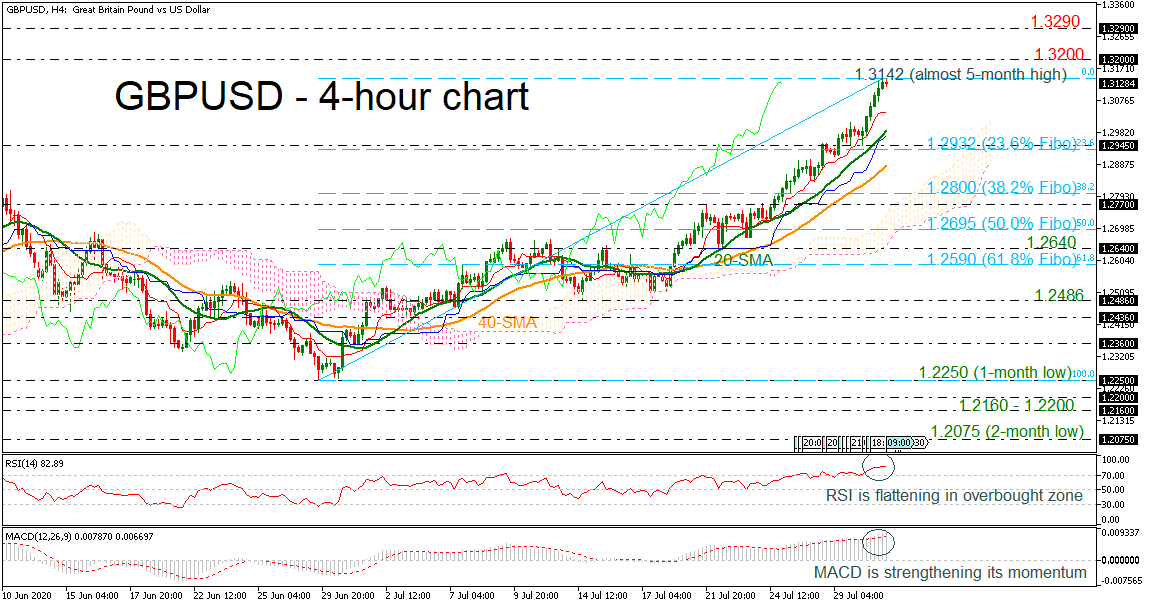
GBPUSD advanced considerably to an almost five-month high of 1.3142 during Thursday’s session, posting six green candles in a row in the 4-hour chart. The MACD oscillator is strengthening its momentum above its trigger and zero lines, however, the RSI is flattening in the overbought territory, indicating a possible downside retracement. The Ichimoku indicators and the short-term moving averages (SMAs) are still suggesting more gains in the near term.
In case the pair rises above the 1.3142 barrier, it could meet resistance at the 1.3200 psychological mark – last seen in March – before travelling towards the December peak of 1.3290.
Otherwise, if the price bounces off its recent high, the 20-period SMA currently at 1.2990 could provide support ahead of the 23.6% Fibonacci retracement level of the up leg from 1.2250 to 1.3142 at 1.2932. Breaching the latter, the 40-period SMA at 1.2880 could next halt the bearish action. If it fails to do so, the decline could stretch towards the 38.2% Fibonacci of 1.2800.
Concluding, GBPUSD has been in an aggressive bullish movement since June 29. A decisive close under the 61.8% Fibo of 1.2590 may shift the positive outlook to neutral.


