
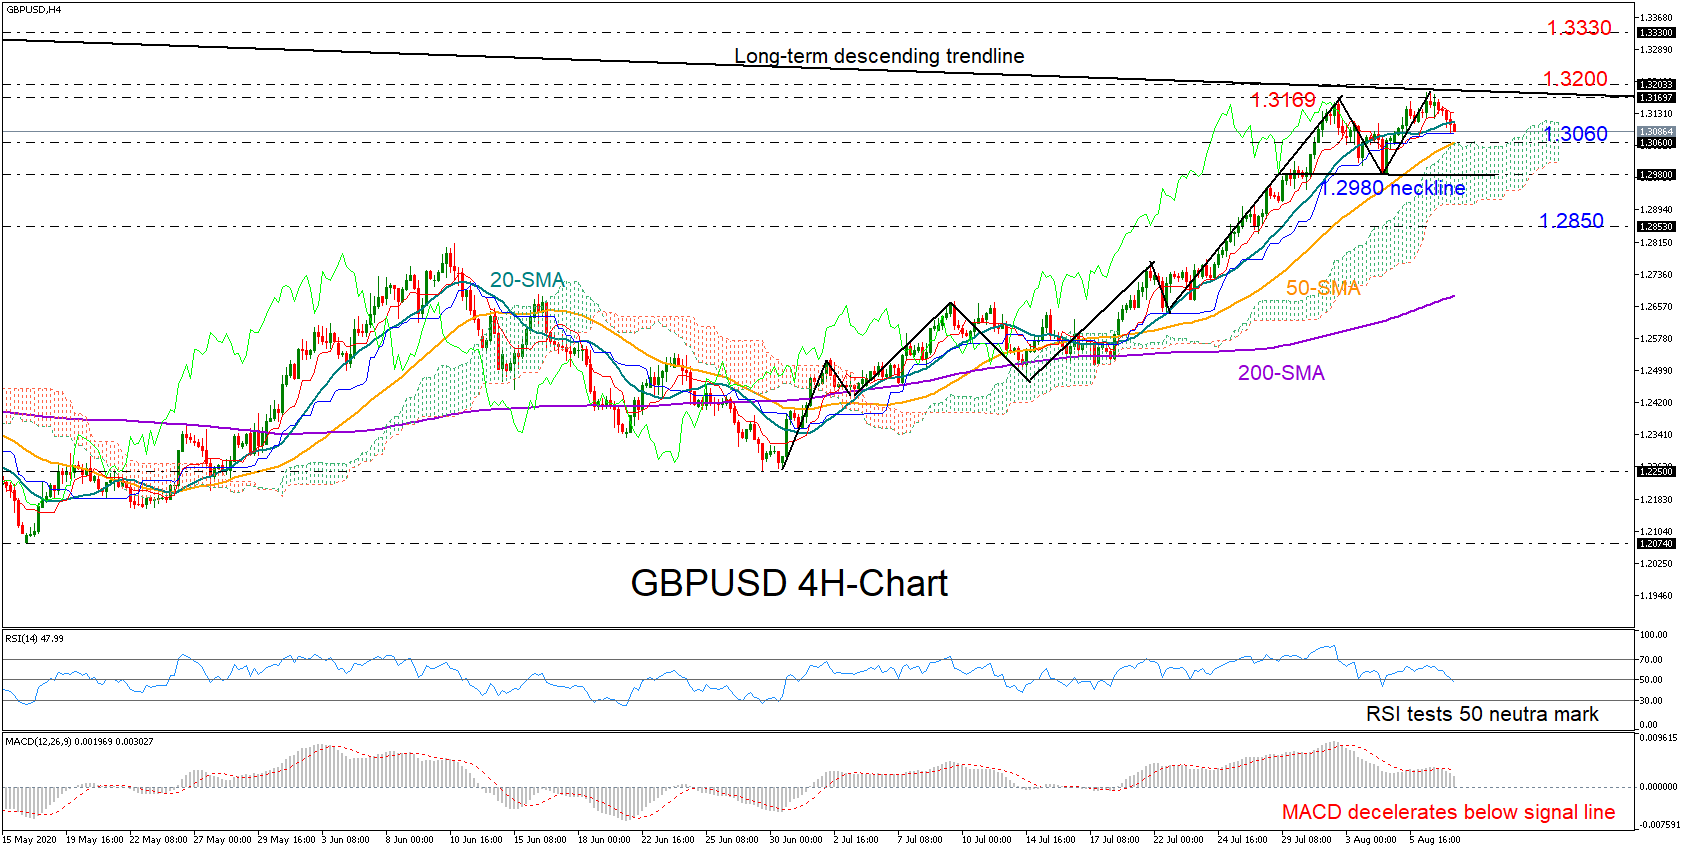
GBPUSD topped around 1.3169 twice in a week and reversed south, raising worries that the bulls may soon give up the game in the four-hour chart.
While the weakness in the RSI and the MACD is justifying the latest negative move, only a sustainable downfall below 1.2980 would confirm a bearish double top formation and hence, trigger sharper losses towards 1.2850. Before that, a break below the 50-period simple moving average (SMA) currently at 1.3060 and into the Ichimoku cloud should also take place.
In the positive scenario, if the blue Kijun-sen line at 1.3090 manages to block the way down as it did several times this week, the bulls may re-challenge the 1.3169 resistance area. The battle could be tough as a long-term descending trendline stretched from the 2015 peaks happens to be in the same neighborhood, making any upside violation at this point crucial. Should the line fall apart, with the price closing above the 1.3200 level too, the rally may get new legs towards the 1.3330 barrier last seen in December.
Summarizing, GBPUSD is indecisive whether it should pause or accelerate its bullish wave. A significant break above 1.3169 could bring new buyers into the market, while a decline below 1.2980 could raise selling exposure.


