
GBPUSD started the week with weak momentum, holding slightly above the supportive red Tenkan-sen line and the 1.3060 level.
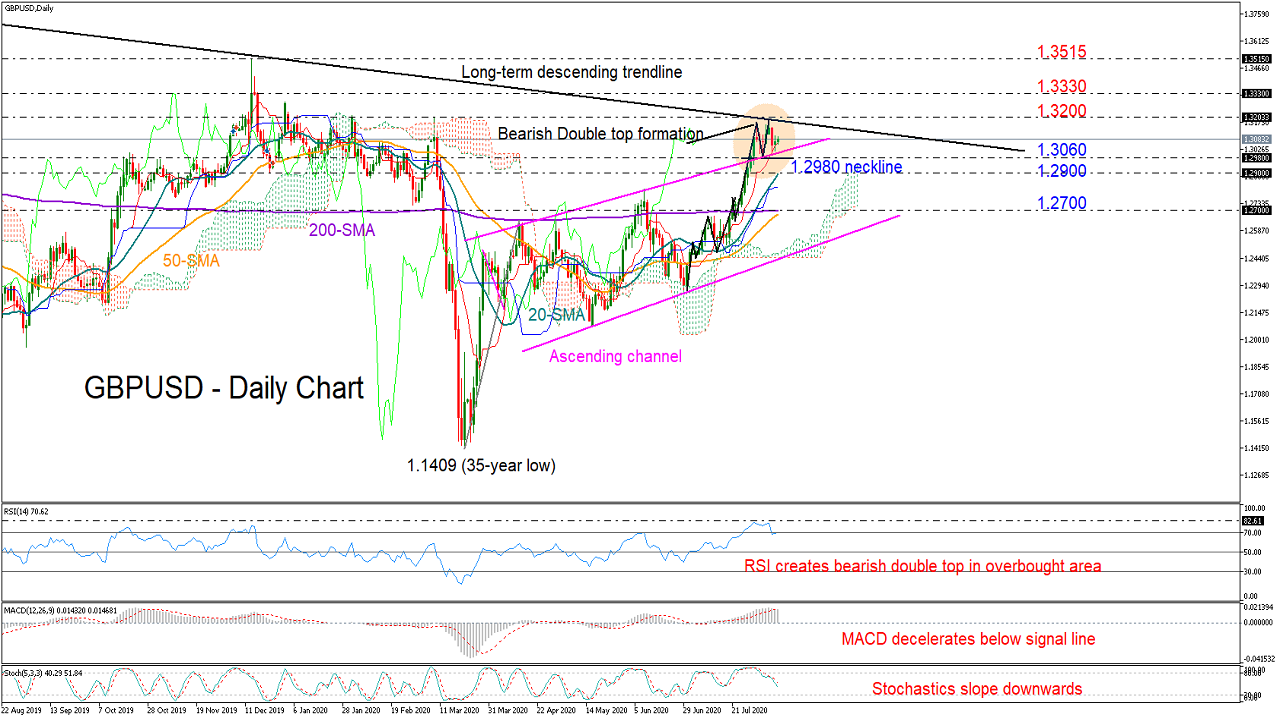
Previously, the pair had jumped out of an ascending channel, raising speculation that the bulls may have further room to run. But a long-term descending trendline stretched from the 2015 peaks managed to halt the price around 1.3170, where the pair now seems to have created a double top formation – a bearish reversal pattern.
In momentum indicators, the RSI has also topped twice in the overbought territory and is currently retracing lower, while the MACD and the Stochastics continue to slope downwards, reflecting increasing negative risks for the market.
Technically, the bears could resurface below the 1.2980 neckline and unless the 20-day simple moving average (SMA) currently at 1.2900 comes to the rescue, the decline may continue until the crossroads of the 200- and 50-day SMAs around 1.2700. Moving lower, the bottom of the channel could be the next key support to watch.
To the upside, the bulls may need to push harder to clear the trendline but if they manage to close clearly above 1.3200, then the door would open for the 1.3330 barrier. Beyond that, the rally may get new legs towards the 2019 top of 1.3515.
Summarizing, negative risks seem to be increasing in GBPUSD, with the pair expected to come under renewed selling pressure below 1.2980. Otherwise, the pair should run above the long-term descending trendline and the 1.3200 mark to upgrade its short- and medium-term outlook.


