
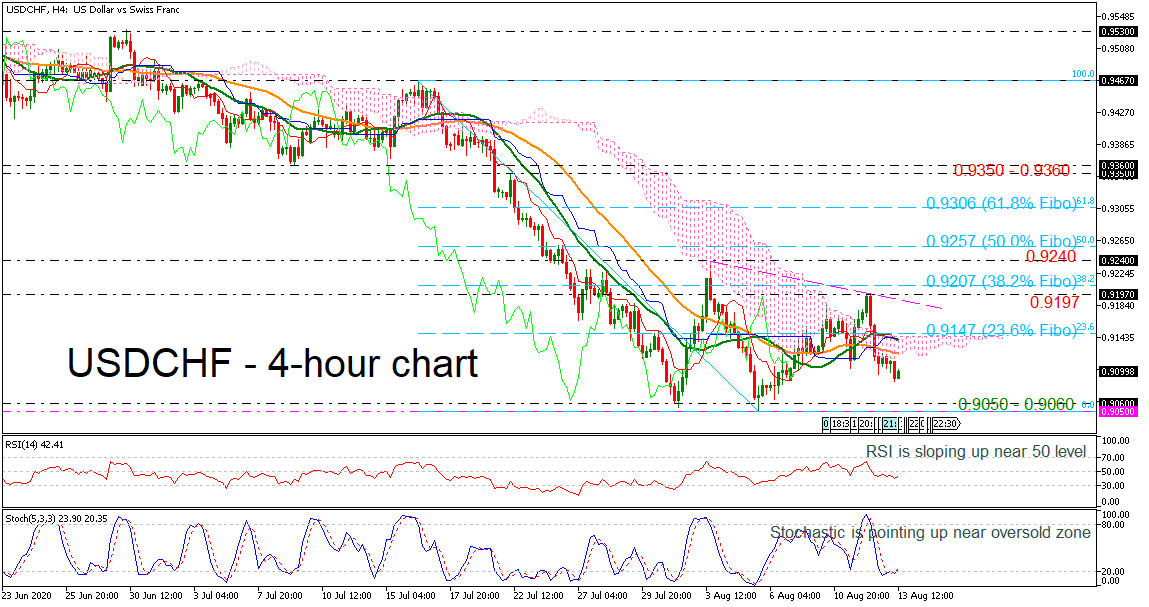
USDCHF has been in a slightly descending movement since August 3 with strong support level at the 0.9050 barrier. Currently, the price is holding beneath the 20- and 40-period simple moving averages (SMAs) and the Ichimoku cloud, however, the technical indicators are suggesting a rebound. The RSI is pointing marginally up in the negative zone, while the stochastic is creating a bullish crossover in the oversold territory.
A climb above the 23.6% Fibonacci retracement level of the down leg from 0.9467 to 0.9050 at 0.9147 could open the door for the falling trend line at 0.9180. A successful penetration of this line could add some buying interest, hitting the 0.9197 resistance and the 38.2% Fibonacci of 0.9207. Above that, the market could challenge the 0.9240 hurdle.
On the other hand, a continuation of the descending movement could hit the 0.9050 – 0.9060 support, registered on August 5 and July 31 respectively. Below that, the pair could meet the 0.9000 psychological number.
Overall, USDCHF is lacking a clear direction in the short-term despite today’s slightly upside momentum on price.


