
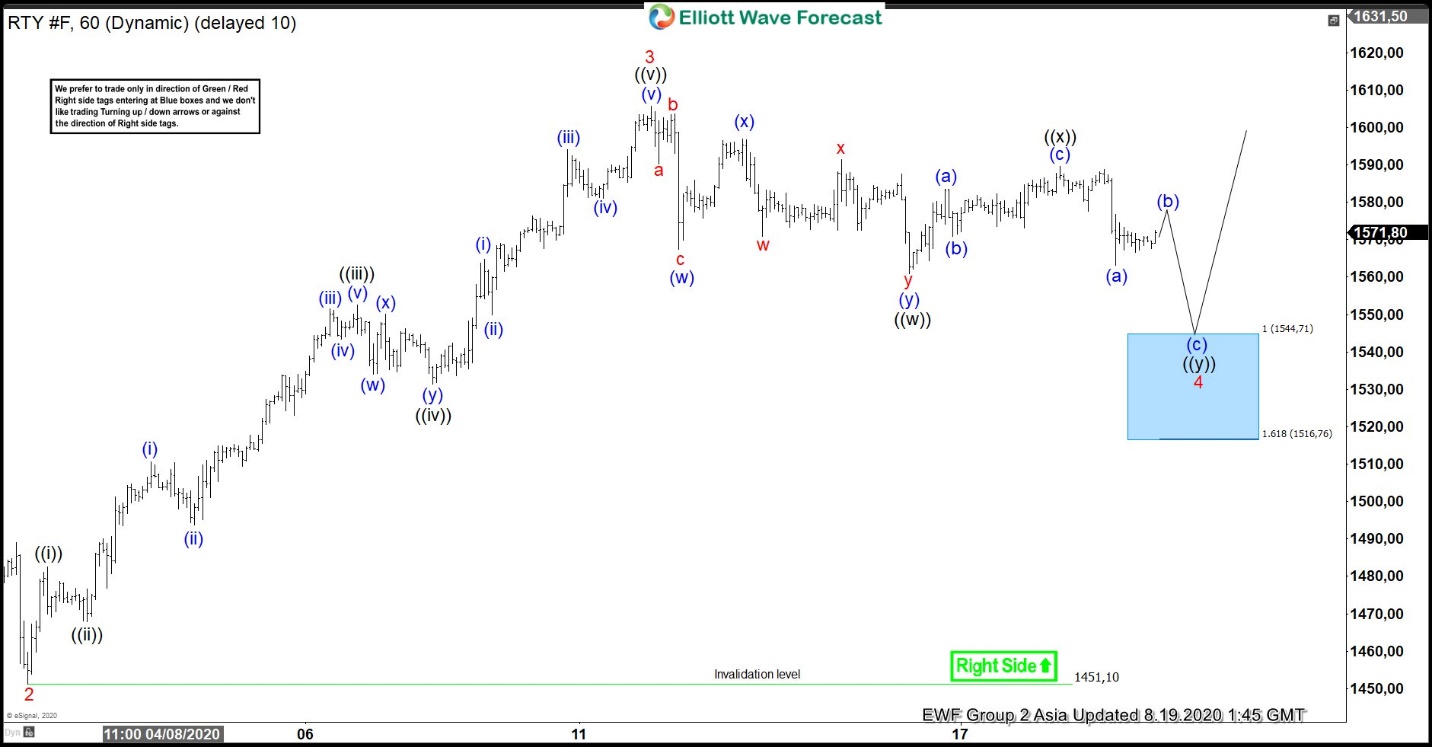
Elliott Wave View of Russell Futures (RTY) suggests the rally from July 31,2020 low has ended at 1605.70 high as wave 3. Up from July 30 low, wave ((i)) ended at 1482.60 high and wave ((ii)) dips ended at 1467.80 low. Index then extended higher in wave ((iii)) towards 1552.60 high. The internal subdivision of wave ((iii)) unfolded as 5 waves impulse Elliott Wave Structure. Wave (i) of ((iii)) ended at 1510.60 high and wave (ii) pullback ended at 1493.70 low. Rally higher in wave (iii) then ended at 1551.60 high, followed by wave (iv) pullback, which ended at 1543.40 low. Wave (v) then extended higher and ended at 1552.60 high.
Afterwards, the Index did a pullback in wave ((iv)), which ended at 1534.20 low. Finally, wave ((v)) higher ended at 1605.70 high. This final move completed wave 3 in higher degree and ended cycle from July 31 low. Index is currently correcting that cycle within wave 4. The correction is unfolding as a double three correction, where wave ((w)) has ended at 1560.90 low. The bounce in wave ((x)) ended at 1589.60 high. Wave ((y)) remains in progress right now. As long as 1451.10 low stays intact, expect the dips in 3,7 or 11 swings to find support for more upside. The 100-161.8% extension of wave ((w))-((x)) where ((y)) can end is at 1516.76-1544.71 area and is shown with a blue box. That area if reached later can produce 3 waves bounce at least.
Russell 2000 (RTY) 1 Hour Elliott Wave Chart


 Statement by the Reserve Bank Board: Monetary Policy Decisions")


