
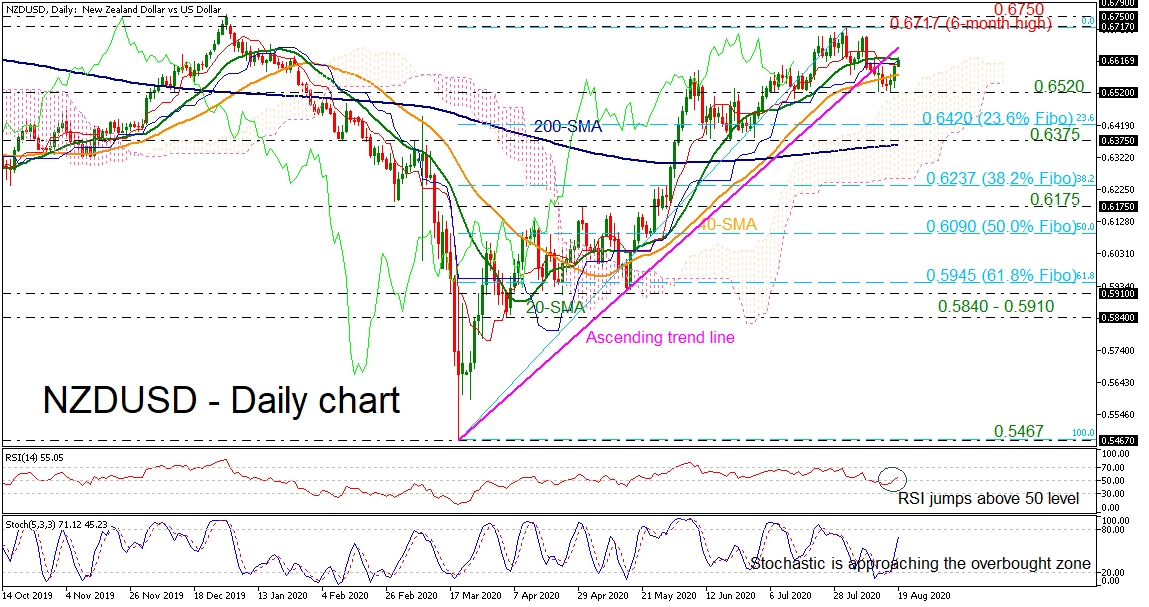
NZDUSD has ticked higher after the drop beneath the five-month ascending trend line in the previous week. The momentum indicators are gaining ground as the RSI surpassed the 50 level and is sloping north, while the stochastic oscillator is heading towards the overbought level following the bullish cross within the %K and %D lines.
The price could hit the six-month peak of 0.6717 ahead of the 0.6750 resistance, registered on December 2019. Even higher, NZDUSD could turn traders’ focus at the 0.6790 barrier, reached on July 2019.
On the flip side, more downside pressure could send the market towards the 0.6520 support below the simple moving averages (SMAs) ahead of the 0.6420 barrier, being the 23.6% Fibonacci retracement level of the up leg from 0.5467 to 0.6717. Below that, the pair could challenge the 0.6375 support, which holds near the 200-day SMA, inside the Ichimoku cloud. Clearing these levels, the 38.2% Fibonacci of 0.6237 could attract attention.
Summarizing, a daily close above the six-month high of 0.6717 could endorse the bullish structure again that started from the 0.5467 trough on March 19.


