
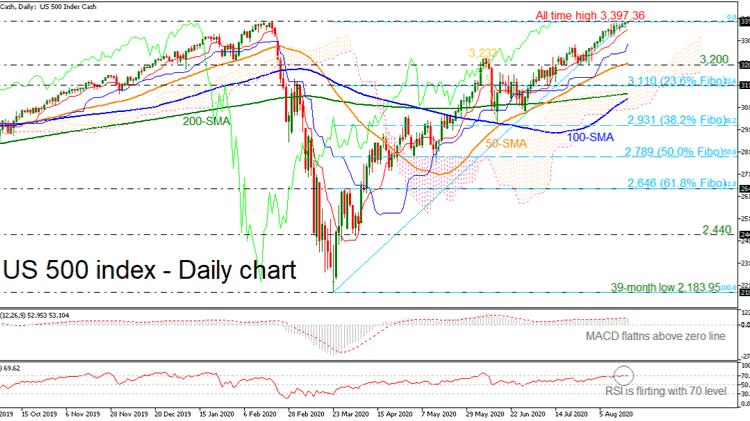
The US 500 index reached another all-time high of 3,397.36 earlier today as the index extends one of its fastest bulls run in its history. The momentum indicators are looking overbought as the RSI is flattening near the 70 level, while the MACD is moving sideways in the positive territory.
Should prices reverse lower, immediate support could come at the red Tenkan-sen and the blue Kijun-sen lines at 3,360 and 3,290 respectively ahead of the 3,200 support, which coincides with the 50-day simple moving average (SMA). Below that, the 23.6% Fibonacci retracement level of the upward wave from 2,183.95 to 3,397.36 at 3,110 is another major support to watch, remaining within the Ichimoku cloud.
To the upside, if the bulls manage to break the record top, resistance may come from 3,722, that being the 261.8% Fibonacci extension level of the down leg from 3,233 to 2,931. Further gains may then encounter the 4,000 handle.
Overall, the US 500 index is strongly bullish as long as it holds above the SMAs, however, the momentum indicators are looking overbought.


