
CADJPY recently found some footing on the 200-day simple moving average (SMA), shifting the momentum to the upside. Aiding an appreciation in the pair are the bullish 50- and 100-day SMAs and the short-term oscillators.
The MACD, in the positive region, has poked above the red trigger line while the RSI is increasing in the bullish section. Additionally, the stochastic oscillator is strengthening its positive tone endorsing further advances.
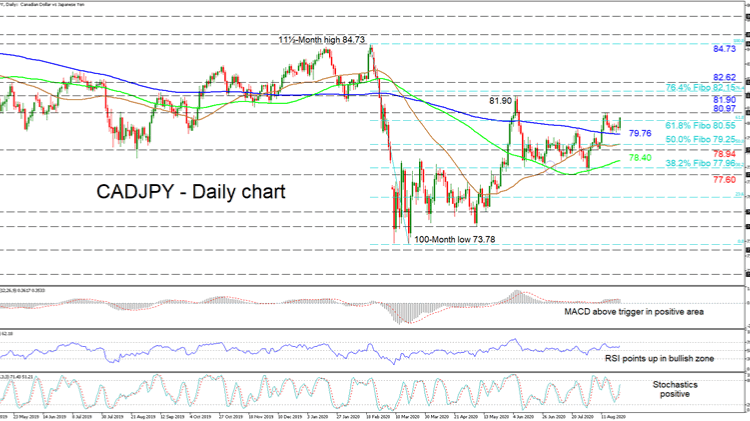
To the upside, clearing the 80.55 level, which is the 61.8% Fibonacci retracement of the down leg from 84.73 to 73.78, initial friction may commence from the nearby 80.97 high. Another run higher may see the bulls encounter a resistance section from the 81.90 peak to the 76.4% Fibo of 82.15. Overcoming this, the price may test the 82.62 obstacle before traders’ attention eyes the 11½-month peak of 84.73.
If sellers resurface and dip under the 200-day SMA at 79.76, a support zone from the 50-day SMA -residing at the 50.0% Fibo of 79.25 – until the 78.94 low may stall the decline, shifting the picture sideways. However, weakening further, the pair could meet the 100-day SMA at 78.40 before challenging the 38.2% Fibo of 77.96 and the 77.60 trough underneath.
Summarizing, the fairly neutral picture in the short-to-medium term is looking increasingly bullish as long as the pair holds above the 200-day SMA. A close above 80.97 could boost the positive picture while a close above 81.90 would cement it.


