
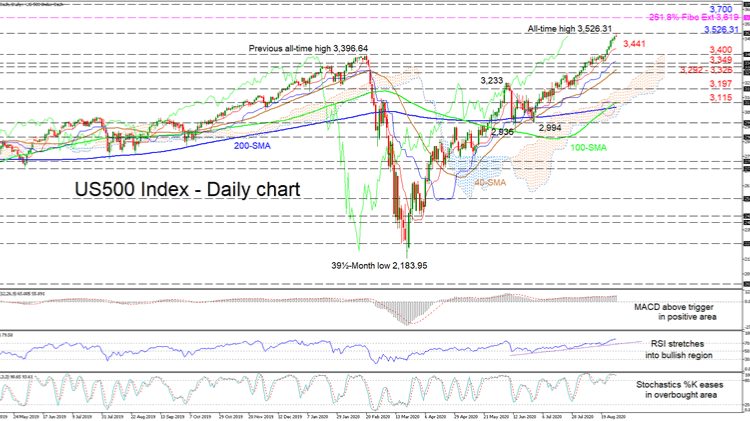
US 500 index (Cash) broke above 3,396.64, accelerating over the last week towards a fresh all-time high of 3,526.31. The advancing Ichimoku lines reflect a sturdy positive tone above the cloud. Moreover, the recent bullish crossover of the 200-day simple moving average (SMA) by the rising 100-day one could further reinforce the positive picture.
The short-term oscillators convey strong positive momentum, which is sponsoring the improving picture. The MACD, in the positive region, has moved above its red trigger line, while the RSI is soaring in overbought territory. The stochastic %K line has faded slightly in the overbought section, but has yet to confirm a shift in the negative direction. Nonetheless, traders cannot rule out a pullback.
To the upside, if buyers manage to maintain appreciation in the index, immediate resistance may come from the new all-time high of 3,526.31. Triumphing above this, the market may target the 3,619 level, that being the 261.8% Fibonacci extension of the corrective wave from 3,233 to 2,994. Gaining more ground may extend the climb to test the 3,700 handle.
Otherwise, if the market retreats, initial support may come from the red Tenkan-sen line at 3,441 ahead of the 3,400 level (previous all-time high area 3,996.64). Next, the index may come to rest at the 3,349 low, where the blue Kijun-sen line resides. Not far beneath, the support region from 3,292 to 3,326, which includes the rising 50-day SMA, may prevent further declines from extending towards the 3,197 trough. However, should additional weakening occur, the price may meet the 100-day SMA at the 3,115 mark.
In brief, the index maintains a sturdy bullish bias above the 3,400 barrier and more importantly above 3,326.


