
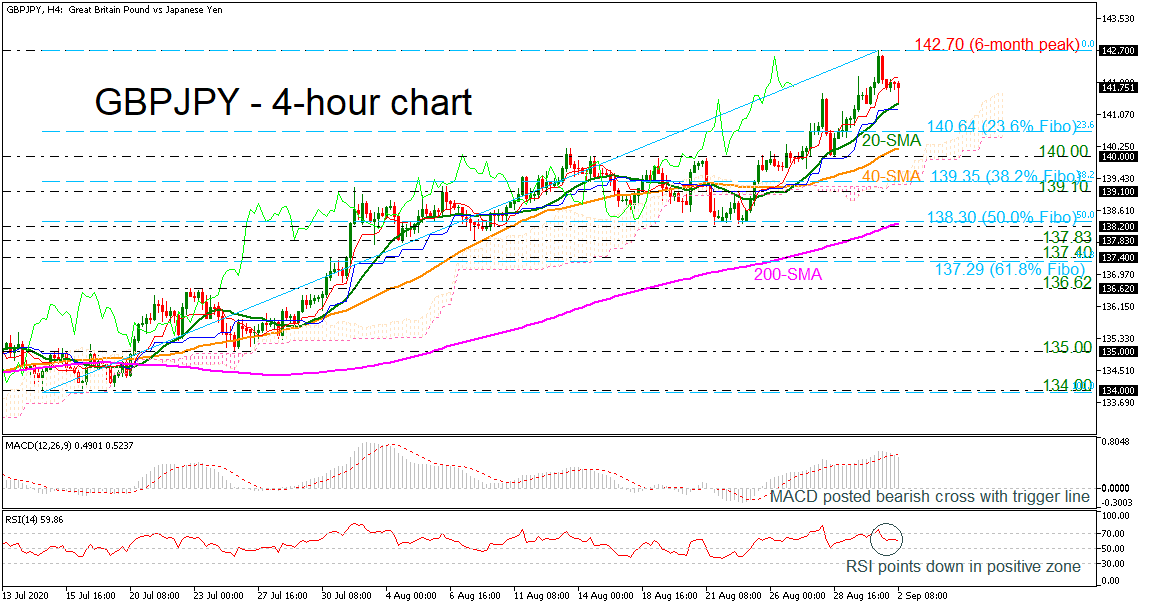
GBPJPY is retreating after finding significant resistance at the six-month high of 142.70 and is now heading towards the 20-period simple moving average (SMA) at 141.30 in the 4-hour chart. The momentum indicators provide negative signals as the MACD oscillator is losing ground after completing a bearish crossover with its trigger line in the positive zone, while the RSI is pointing south after the pullback in the overbought territory.
In the light of negative pressures, a tough support could initially develop near the 23.6% Fibonacci retracement level of the up leg from 134.00 to 142.70 at 140.64. Moving lower, the 40-period SMA at 140.19 and the lower surface of the Ichimoku cloud around the 140.00 handle could be tested. Breaking beneath that area, the 38.2% Fibonacci of 139.35 may also attempt to halt additional losses towards the 139.10 barrier.
If buying interest intensifies, resistance may originate from the six-month peak of 142.70. Overcoming this boundary, the price may head for the 144.90 high from February 21.
In brief, the very short-term bias is bearish, however, looking at the bigger picture, the bullish outlook remains in place since July 14.


