
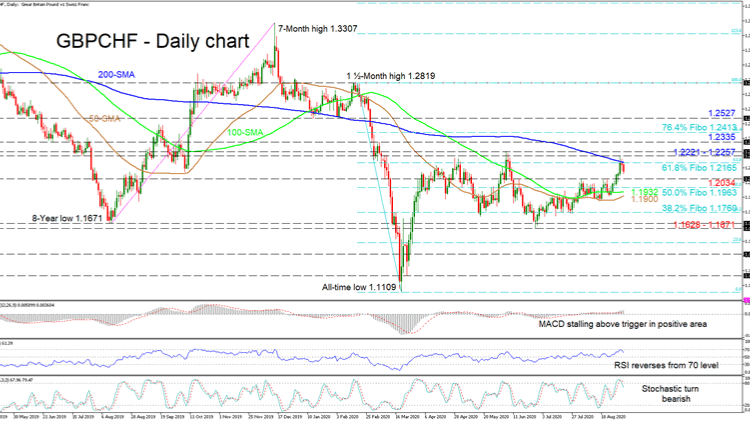
GBPCHF pivoted at the 200-day simple moving average (SMA) preserving the horizontal structure and reinforcing its confines of 1.1628 and 1.2257. The 50- and 100-day SMAs have adopted a relatively neutral bearing, which may be aiding the directionless market.
Nonetheless, the short-term oscillators mirror the recent weakness in the price suggesting growing negative momentum. The MACD, in the positive region, stands above its red trigger line but looks to have paused. The falling RSI deflected off the 70 mark, while the stochastic oscillator shifted bearish, both promoting additional losses.
If sellers keep control, initial support may occur at the 1.2034 barrier before the 1.1963 level, that being the 50.0% Fibonacci retracement of the down leg from 1.2819 to 1.1109. Slightly lower, the 100- and 50-day SMAs of 1.1932 and 1.1900 respectively may impede the drop from reaching the 38.2% Fibo of 1.1760. Additional losses may then challenge the foundation of the range from 1.1628 to 1.1671.
If buyers resurface, resistance may originate from the capping 200-day SMA residing at the 61.8% Fibo of 1.2165, ahead of the ceiling section of 1.2221 – 1.2257 of the consolidation. Breaching this roof, a nearby key high at 1.2335 may deny advances from unfolding further. However, should positive sentiment withstand these pressures, the pair may target the 76.4% Fibo of 1.2413 ahead of the 1.2527 inside swing low.
Summarizing, the short-to-medium-term timeframe remains range bound. A break either above 1.2257 or below 1.1628 would reveal the next clear direction.


