
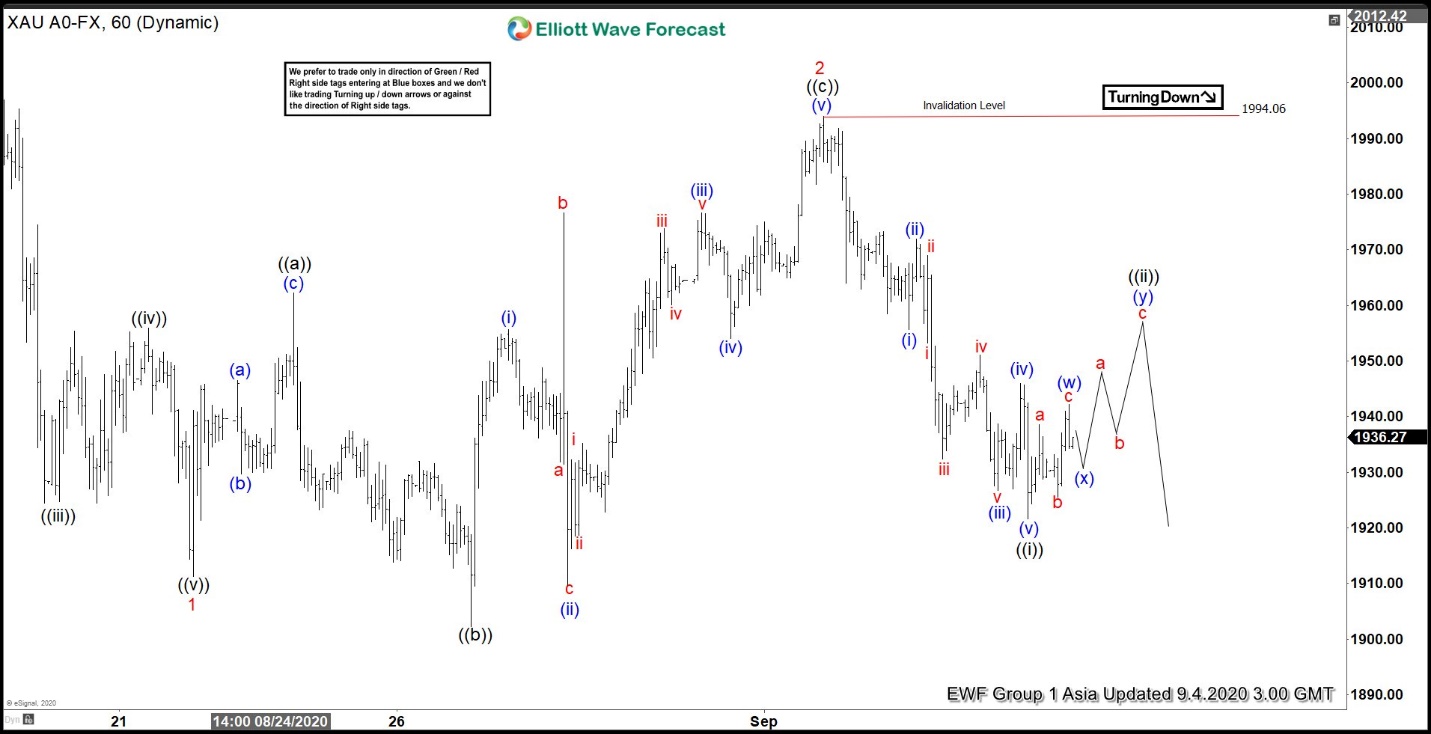
Gold 1 hour chart below shows that the metal has ended the cycle from August 18 high in wave 1 at 1911.20 low. From there, the metal then bounced higher and ended wave 2 at 1994.06 high. The bounce unfolded as flat Elliott Wave Structure. From wave 1 low, wave ((a)) ended at 1962.18 high. Wave ((b)) then ended at 1902.30 low. The metal then extended higher in wave ((c)), which ended at 1994.06 high. This ended wave 2 in larger degree.
Down from wave 2 high, the metal has resumed lower in wave ((i)), which ended at 1921.66 low. The subdivision of wave ((i)) unfolded as 5 waves impulsive Elliott Wave Structure. Wave (i) ended at 1955.70 low and the bounce in wave (ii) ended at 1967.45 low. Wave (iii) then ended at 1926.80 low and wave (iv) ended at 1945.94 high. The push lower in wave (v) ended at 1921.66 low. Currently, wave ((ii)) is in progress. While below 1994.06 high, expect bounce in 3,7 or 11 swings to fail for more downside. However, gold needs to break below August 12 low to confirm that next leg lower has started. If that low is broken, then the target to the downside is the 100% extension from August 7 high at 1800 level.
Gold 1 Hour Elliott Wave Chart


