
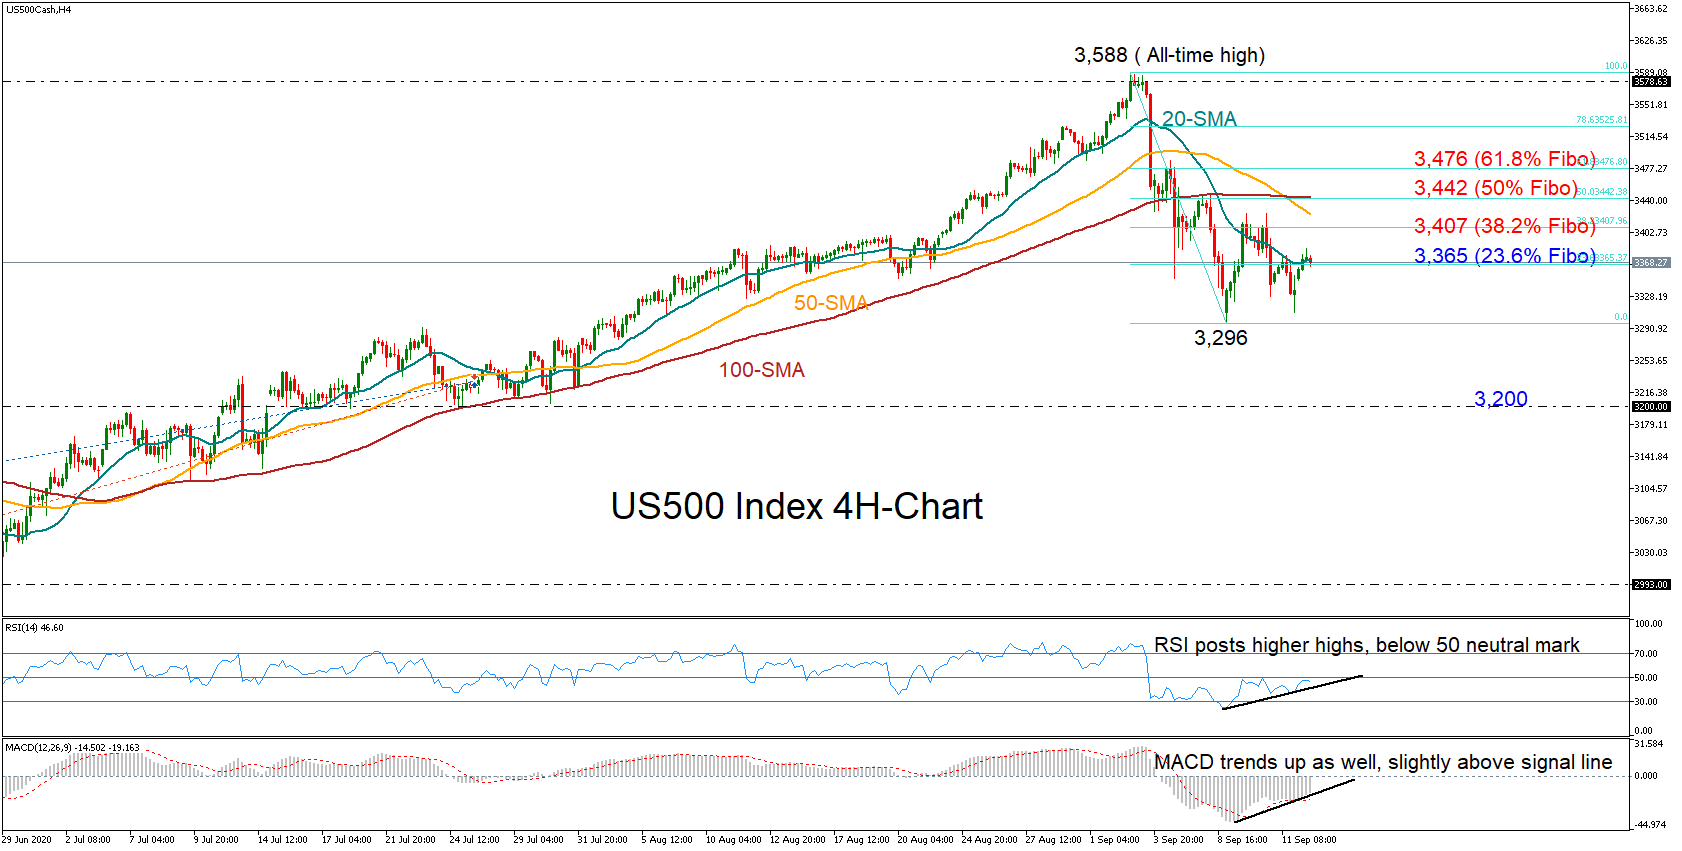
The US 500 stock index (cash) is in a recovery mode and ready to return above the 20-period simple moving average (SMA) in the four-hour chart after refusing to step below the 3,296 bottom.
The RSI and the MACD have posted higher lows, indicating an improving short-term bias. However, any additional upside correction may not be attractive enough unless the index jumps above the 100-period SMA, which had strongly rejected the bulls early in August. The 50% Fibonacci of the recent bearish wave at 3,442 also happens to be in the neighborhood, adding extra importance to the area. Before we reach that level though, some consolidation may emerge between the 38.2% Fibonacci of 3,407 and the 50-period SMA. In case the rally extends beyond 3,442, it could gain fresh momentum above the 61.8% Fibonacci of 3,476.
In the event the market pulls back below the 20-period SMA and the 23.6% Fibonacci of 3,365, the way would open towards the 3,296 floor. If the bears win the battle at this point, a more aggressive sell-off may prevail towards the 3,200 support level, resuming concerns of a progressing downtrend.
Summarizing, although the US500 index is looking ready to recoup previous losses, buying exposure may not increase unless the price overcomes the 3,442 barrier.


