
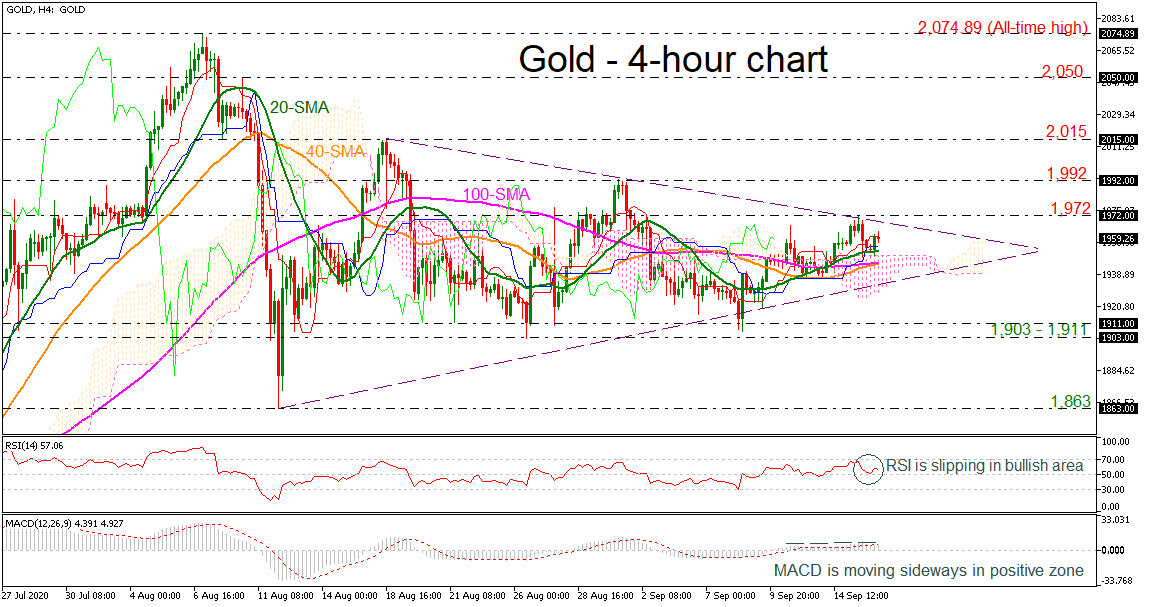
Gold prices have been trading within a triangle formation in the short term with a break outside it likely to determine the next trend direction.
Looking at momentum oscillators on the 4-hout chart, they suggest further sideways moves may be on the cards. The RSI is pointing south above its neutral 50 line, detecting negative momentum, while the MACD lies below its trigger line with horizontal movement above its zero level. Currently, the precious metal stands above the short-term moving averages and the Ichimoku cloud but the bullish structure is fading.
However, if the bulls retake control, price advances may stall initially near the latest highs at 1,972, and subsequently near the descending line of the symmetrical triangle. A potential upside violation of this barrier could take the commodity until the 1,992 and the 2,015 resistances. Even higher, the market could reach the 2,050 hurdle, identified on August 10.
On the other hand, a successful break beneath the simple moving averages (SMAs) could drive gold towards the lower surface of the Ichimoku cloud and the uptrend line around 1,938. Steeper losses could see the 1,903 – 1,911 support zone ahead of the 1,863 level, shifting the neutral bias to bearish in the near term.
In brief, gold prices have been holding in a symmetrical triangle since August 12 and traders may wait for a clear close outside of this formation to have the next direction.


")


