
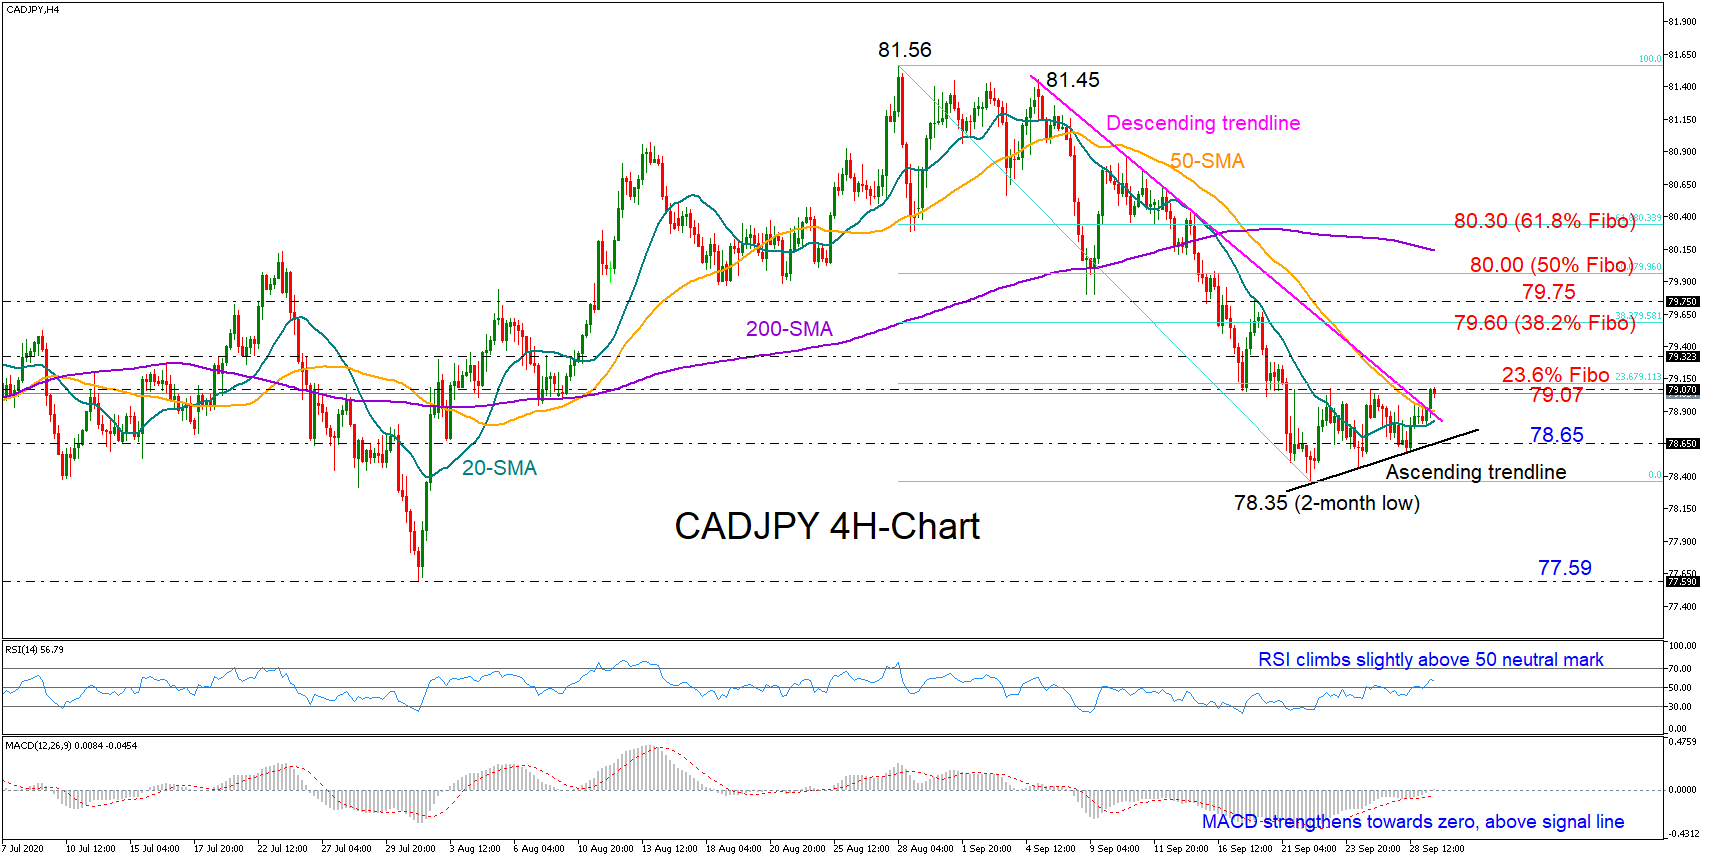
CADJPY has been slowly deviating above a two-month low of 78.35 over the past week in the four-hour chart, though a descending trendline drawn from 81.45 and the nearby ceiling of 79.07 have been a hidrance, keeping the pair in a range.
The pair is currently pushing for a close above these boundaries and its 50-period simple moving average (SMA) as the momentum indicators seem to be taking the bulls’ side. The MACD continues to strengthen above its red signal line and towards the positive area, while the RSI is trying to expand above its 50 neutral mark.
A decisive close above the 79.07 number, which is marginally below the 23.6% Fibonacci of the 81.56-78.35 downleg, could trigger a new bullish action likely towards the 38.2% Fibonacci of 79.60 and the 79.75 swing high. Should the rally extend beyond the 80.00 mark, where the 50% Fibonacci is placed, the 200-period SMA may come under the spotlight ahead of the 61.8% Fibonacci of 80.30.
On the flip side, the bears may get the upper hand If the pair decelerates below the short-term ascending trendline, bringing the 78.35 bottom back under the spotlight. An extension below the latter could stretch until July’s trough of 77.59.
Summarizing, CADJPY could confirm a bullish bias above 79.07, with immediate resistance expected to emerge around 79.60. On the other hand, a drop below 78.65 may encourage stronger selling.


