
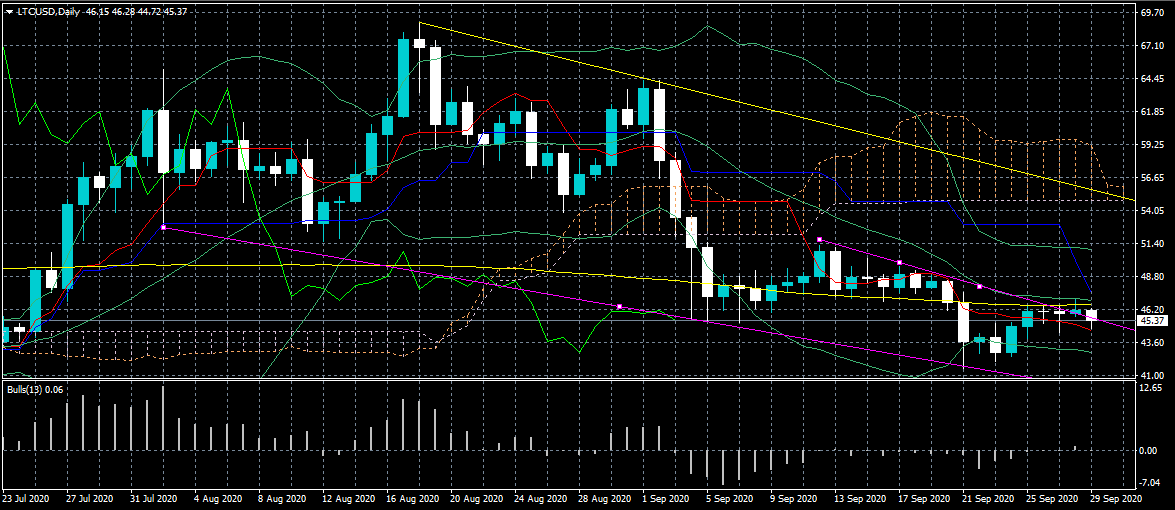
Litecoin is searching for direction in the near-term as the cryptocurrency attempts to edge away from the worst levels of the month. Lower time frame analysis shows that a bullish falling wedge pattern points to a coming rally towards the $55.00 area. In the near-term, LTCUSD bulls need to close the daily candle above the pairs 200-day moving average, around $46.50, to encourage fresh technical buying.
The LTCUSD pair is only bullish while trading above the $51.00 level, key resistance is found at the $52.50 and the $57.50 levels.
If the LTCUSD pair trades below the $51.00, sellers may test the $43.00 and $36.00 support levels.


