
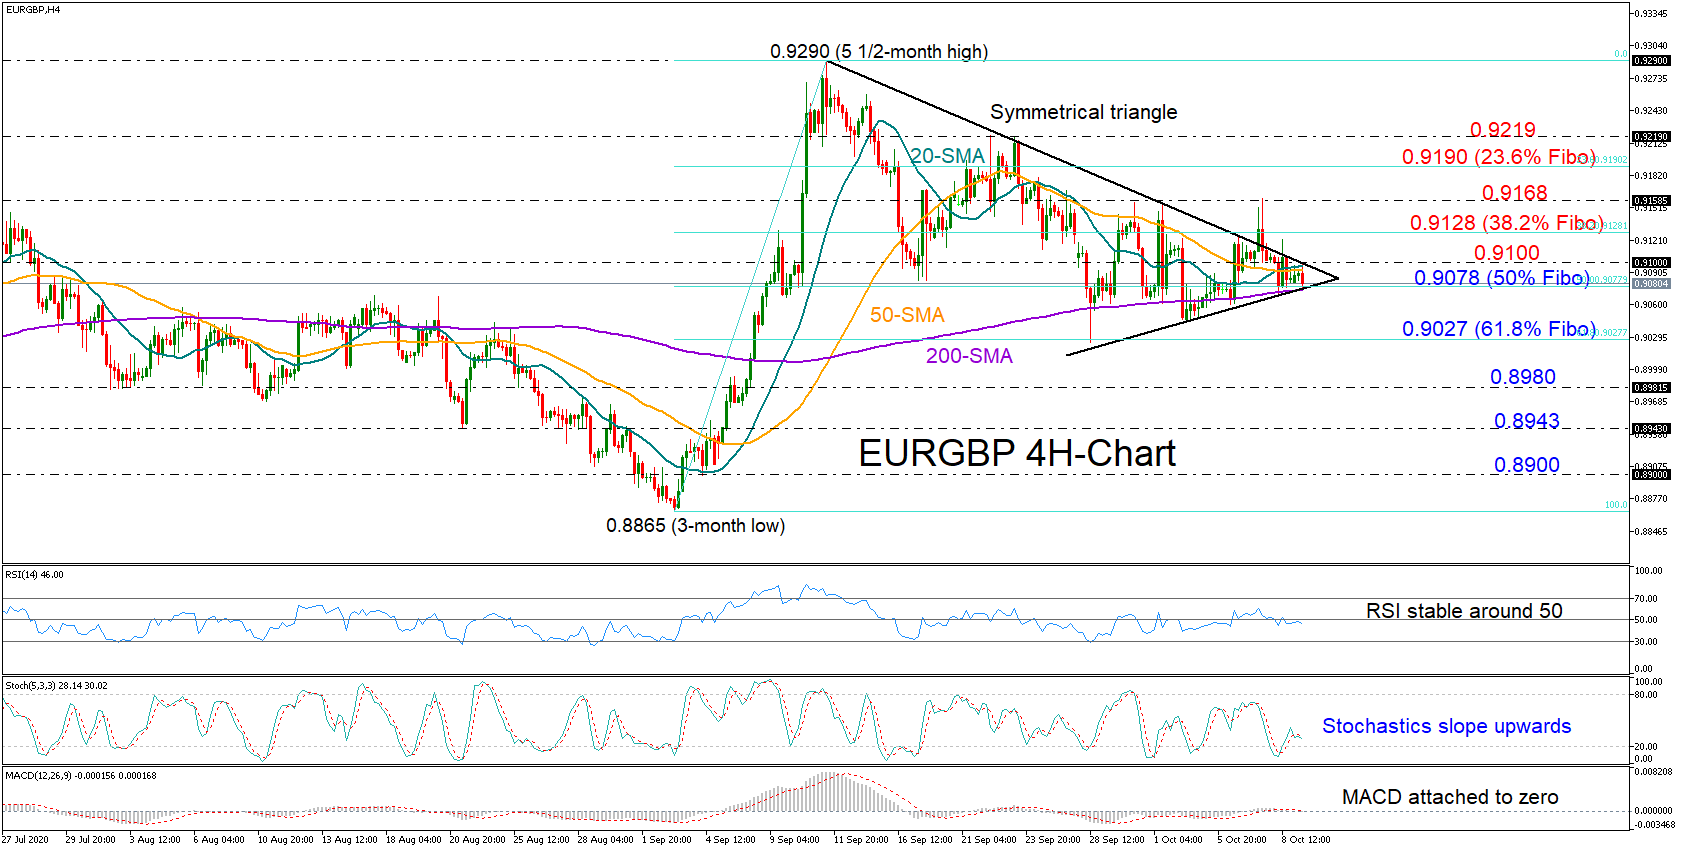
EURGBP turned less volatile within a symmetrical triangle in the four-hour chart, hinting that another breakout may happen soon following Thursday’s failure.
The technical indicators are currently painting a neutral picture for the short term as the RSI is testing its 50 neutral mark from the downside, the MACD is attached to its zero line, and the Stochastics seem to be stabilizing.
Should the price violate the 0.9100 level and hence exit the triangle on the upside, the bulls may attempt again to jump the wall between the 0.9128 and 0.9168 boundaries, which also encapsulate the 38.2% Fibonacci retracement of the 0.8865-0.9290 upleg. If efforts prove successful, the pair may mark a higher high somewhere between the 23.6% Fibonacci of 0.9190 and September 22’s peak of 0.9219, eliminating fears of a downtrend.
Otherwise, if sellers manage to pressure the pair below the triangle, piercing the 200-period simple moving average (SMA) and the 50% Fibonacci of 0.9078 too, support may run towards the 61.8% Fibonacci of 0.9027. A step lower would bring the case of a down-trending market back on the cards, likely sparking a more aggressive decline towards the 0.8980-08943 zone.
Meanwhile, in the six-month picture, the market remains neutral, fluctuating inside the wide range of 0.8670-0.9497.
In brief, the short-term risk for EURGBP is looking neutral, with buying interest expected to surge above 0.9100. Alternatively, a close below 0.9078 would give the lead to the bears.


