
EUR/USD is testing the Fibonacci support levels. Price action is expected to make a bullish reversal at the Fibs despite the bearish breakout.
The EUR/USD has reached the 61.8% Fibonacci level, but we are expecting a deeper push lower. The main target is the 78.6% Fib around 1.1650.
How far can price fall before finding support? And what are the bullish targets?
Price Charts and Technical Analysis
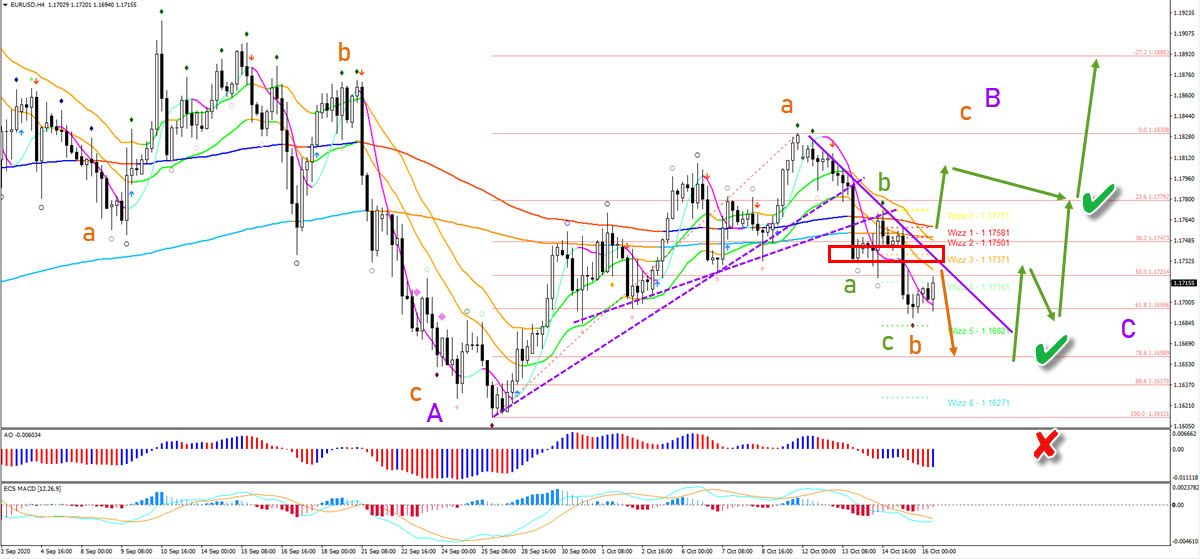
The EUR/USD has reached the 61.8% Fibonacci level, but we are expecting a deeper push lower. The main target is the 78.6% Fib around 1.1650.
The resistance levels (red box) and the 21 ema zone are expected to stop price action from moving higher. Only a breakout above the long-term moving averages would indicate an immediate push up.
Price action should make a bullish bounce at the Fib levels. This would complete a bearish ABC (green) within wave B (orange) and confirm the start of the wave C (orange). Only a break below the bottom invalidates the current ABC (orange) wave pattern.
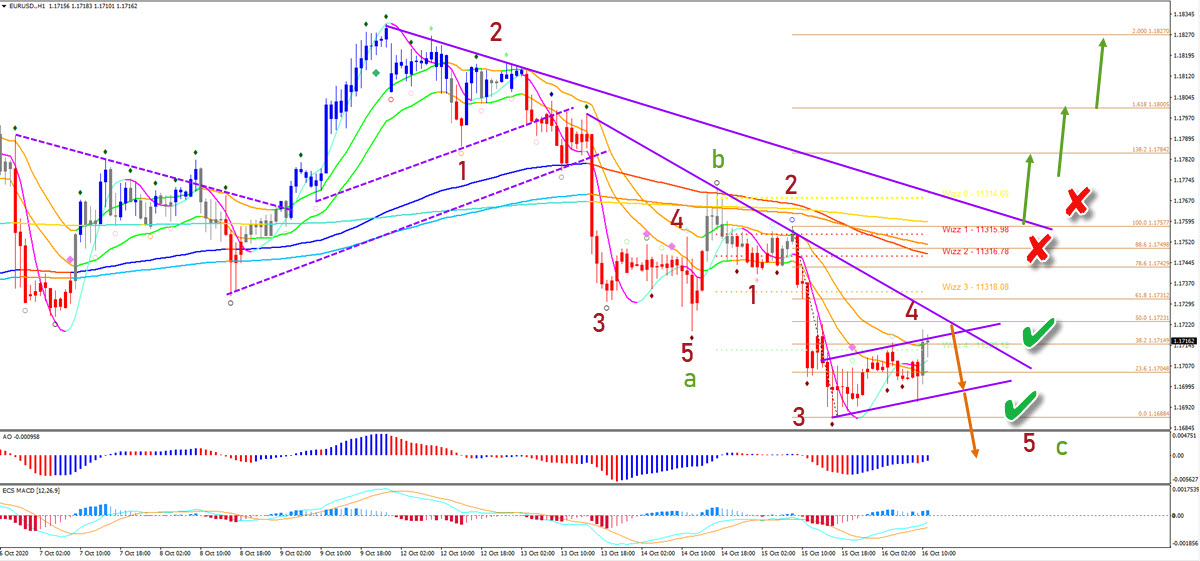
On the 1 hour chart, we see the main reason why one more bearish price swing is anticipated. The bear flag chart pattern is typical for a wave 4 (red) after price action showed a strong bearish impulse (wave 3).
The wave 4 is invalid if price action is able to break above the bottom of the wave 1 (red x). Also candlesticks that fully break above the 21 ema zone could be a first warning of a pending change in direction.


