
The US 30 index (cash) is set for its largest weekly loss since June after plummeting by almost 3% on Wednesday.
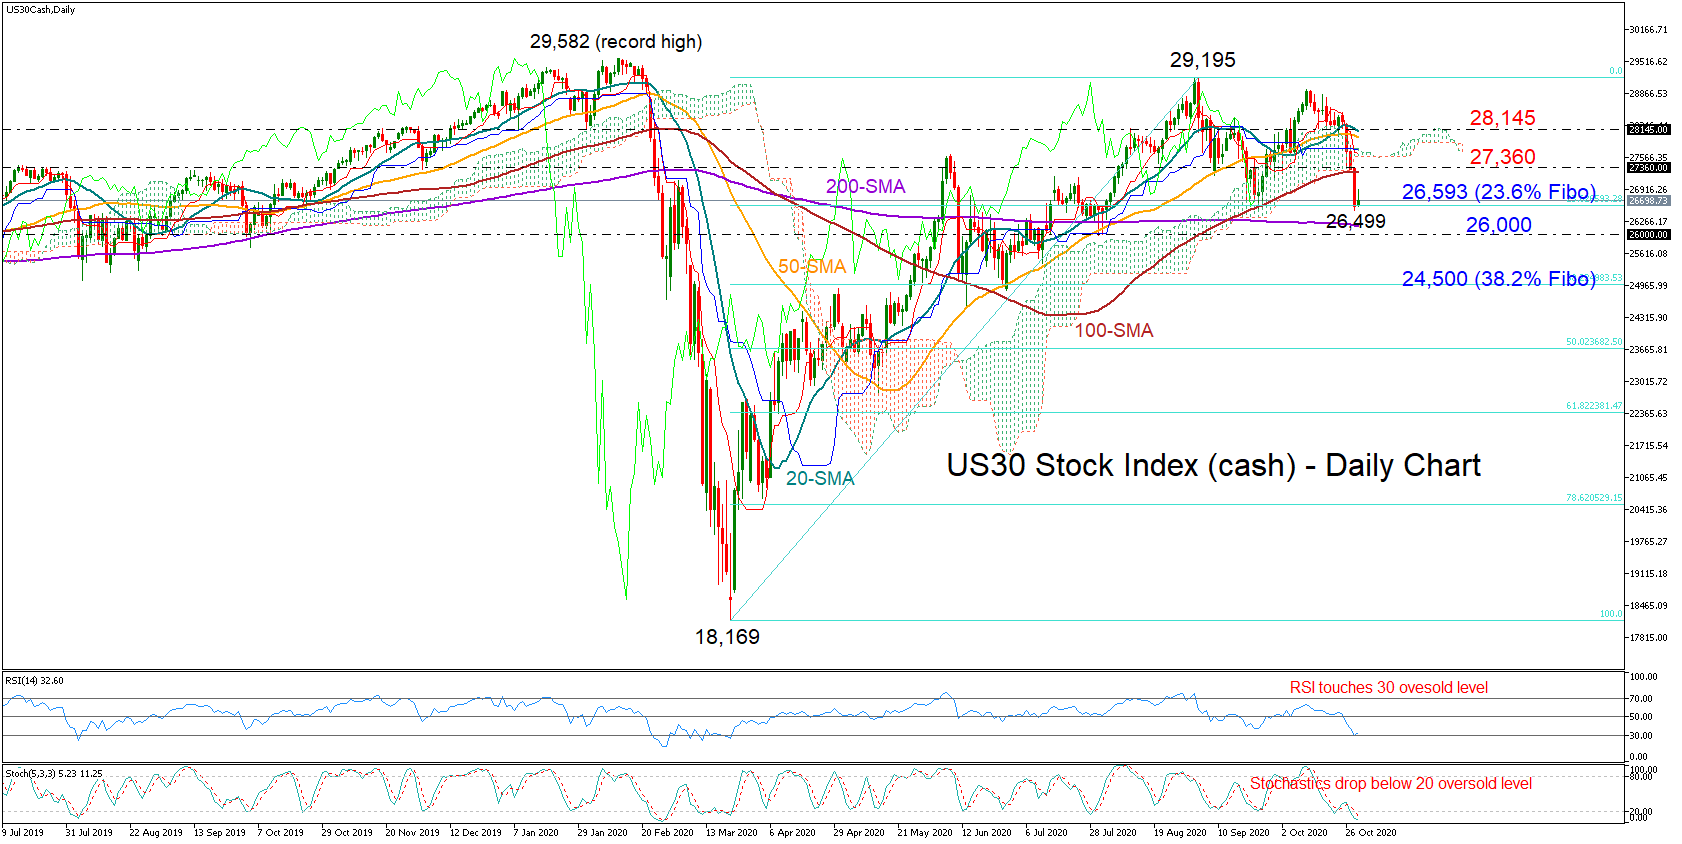
The 100-day simple moving average (SMA) could not catch the fall as it notably did back in June and September, letting the price hit a fresh low of 26,499 below the Ichimoku cloud and slightly beneath its previous trough, a move that created question marks about the sustainability of the March uptrend.
With the RSI and the Stochastics hinting at oversold conditions, an upside correction or some stabilization should not be a big surprise in the short term. Besides, the 23.6% Fibonacci of the March rally at 26,593 is currently adding some floor, while the 200-day SMA is also in the neighborhood, flagging the potential for a rebound.
Nevertheless, if the bears manage to pierce the 200-day SMA and clear the 26,000 level too, the decline could see a continuation until the 38.2% Fibonacci of 24,500.
Alternatively, if the 23.6% Fibonacci holds firm, the price may revisit its 100-day SMA, which is currently placed near the former key restrictive area of 27,360. Beyond that mark, the bulls may attempt to eliminate downside risks and reactivate the uptrend above the shorter-term SMAs seen around 28,145.
Summarizing, the US 30 index is looking strongly bearish but has the potential to bounce in the short run as the price is trading near oversold waters. Failure to hold above the 200-day SMA and the 26,000 level could trigger the next selling wave.


