
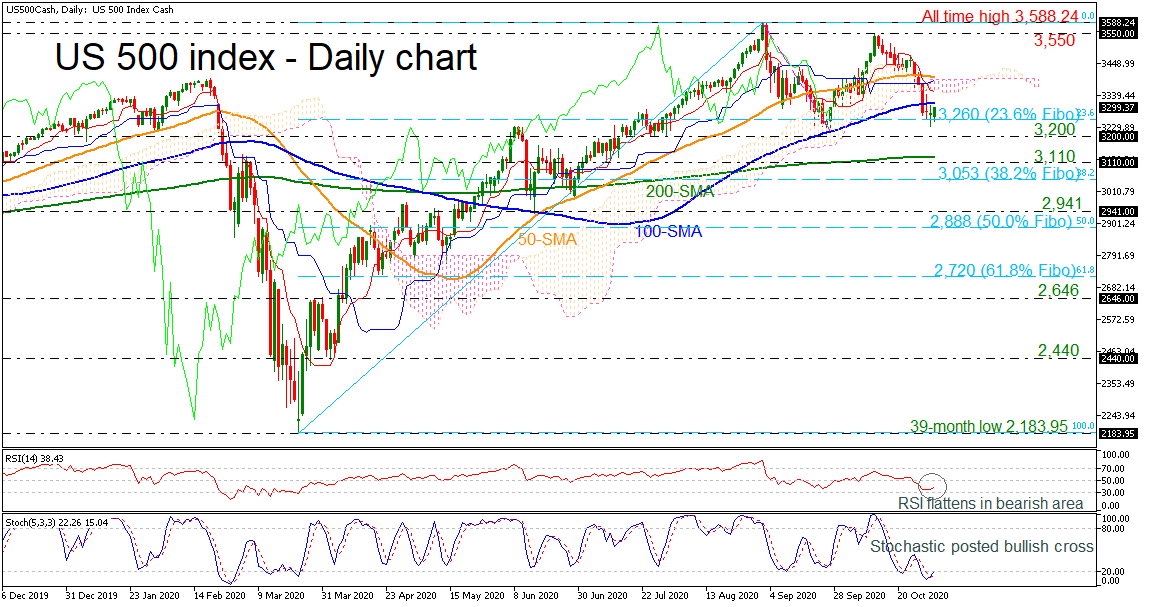
The US 500 index (cash) found key support at 3,260, being the 23.6% Fibonacci retracement level of the up leg from 2,183.95 to 3,588.24 over the last couple of days. After the strong negative sessions in the preceding month, the index is trying to gain some ground with the RSI indicator sloping marginally up and the %K line of the stochastic oscillator, creating a bullish crossover with the %D line in the oversold territory.
Upsides moves are likely to find resistance at the 200-day SMA currently at 3,312. There is an important resistance zone between the lower surface of the Ichimoku cloud at 3,346 and the 40-day SMA at 3,404. Rising above this area would help shift the focus to the upside towards 3,550. Breaking this level could see a re-test of the all-time high of 3,588.24 and turn the current neutral bias back to bullish.
Should prices reverse lower, immediate support could come from the 3,200 level ahead of the 100-day SMA, which holds near the 3,110 barrier. A drop below this area, would take the index towards the 38.2% Fibonacci of 3,053 before flirting with the 2,941 line.
To conclude, the index has been in a horizontal trajectory over the last month as it has failed to improve the long-term picture.


