
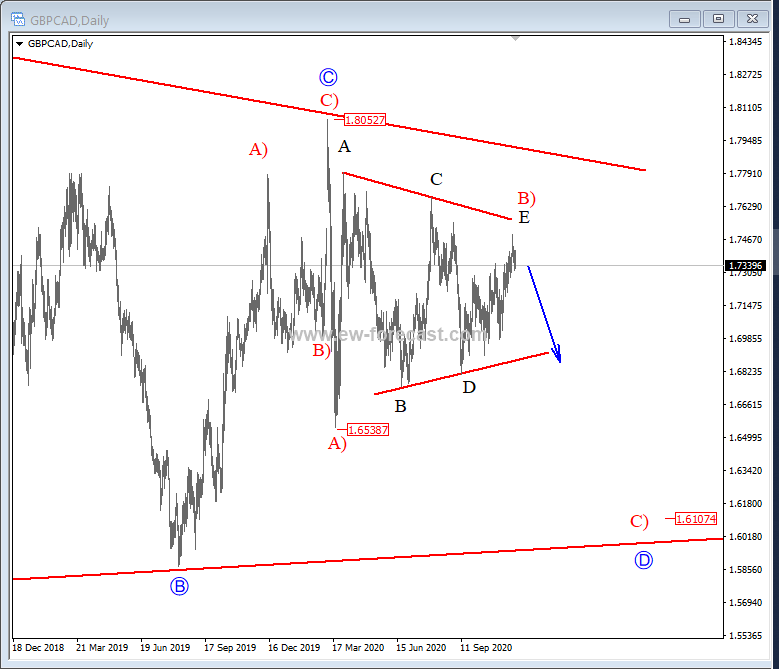
GBPCAD can be trading in a big triangle correction, visible on the weekly time frame, however in this article we are going to show you only one part of it. On the daily chart of GBPCAD we see price making a bigger, three-wave decline, down from 1.805 level, which can be part of a wave D of a triangle. We see first leg A) as completed from the highs, and recent corrective, choppy, slow, and contracting price activity as a triangle pattern within a leg B). This minor triangle in wave B) can be near completion, as all five sub-waves are visible, therefore we should be aware of a new impulsive decline in days or weeks to follow. We want to see an impulsive break below the lower triangle line, which will confirm a completed corrective leg B), and leg C) impulse lower to be underway, ideally targeting the 1.61 area.
GBP/CAD, daily
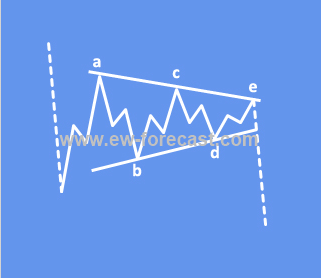
A Triangle is a common 5-wave pattern labelled A-B-C-D-E that moves counter-trend and is corrective in nature. Triangles move within two channel lines drawn from waves A to E, and from waves B to D. A Triangle is either contracting or expanding depending on whether the channel lines are converging or expanding. Triangles are overlapping, five wave affairs that subdivide into a 3-3-3-3-3 form.
Triangles can occur in wave 4, wave B, wave X position or in some very rare cases also in a wave Y of a combination.
Symmetrical triangle in downtrend:


