
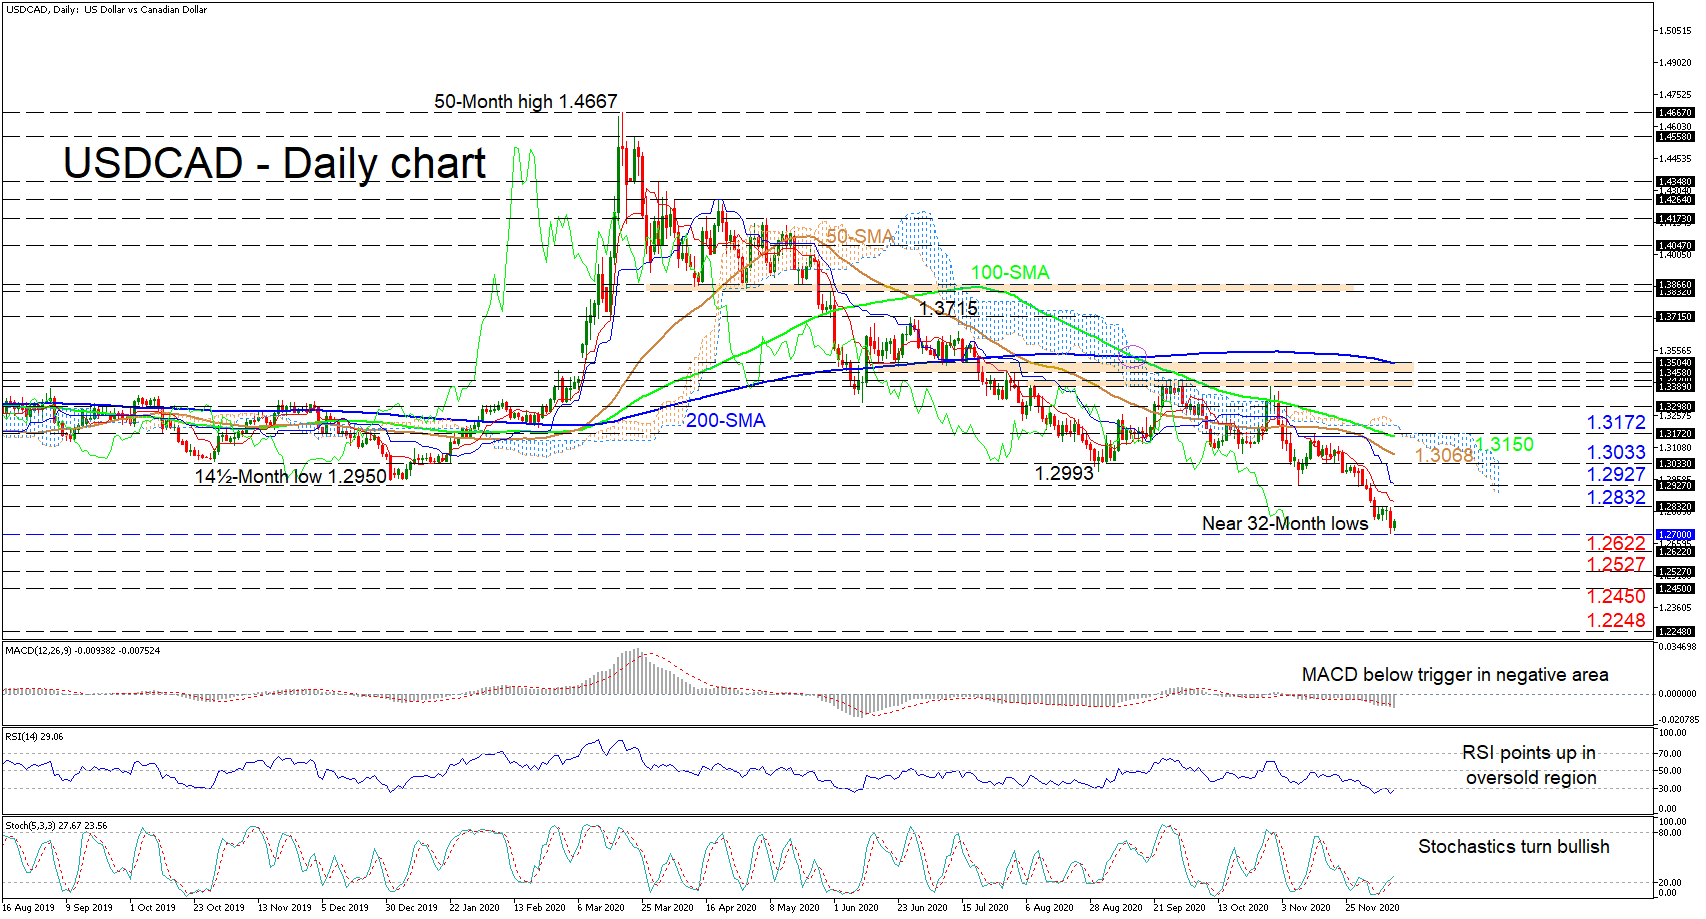
USDCAD is finding some footing around the 1.2700 handle, while prevailing negative pressures are reinforcing downside risks. The dipping 200-day simple moving average (SMA) and the diving 50- and 100-day SMAs are strengthening the bearish structure. Additionally, the descending Ichimoku lines are further dampening the pairs’ existing picture.
The short-term oscillators presently are reflecting mixed signals in directional momentum. The MACD, in the negative region, is declining below its falling red trigger line. However, the RSI is pointing upwards and is trying to push above the 30 level, while the stochastic oscillator has turned bullish, both suggesting some improvements in price.
In a negative scenario, a thrust underneath the 1.2700 hurdle may see sellers initially meet the 1.2622 barrier ahead of the 1.2527 trough of April 2018. Should the pair then dive underneath this key border, support could come from the 1.2450 low achieved in February of 2018, before sellers target the critical 1.2248 trough, identified in January 2018.
On the other hand, if price progresses it may face initial resistance from the 1.2832 high and the red Tenkan-sen line overhead. Overrunning this, buyers may then hit the 1.2927 inside swing low, where the blue Kijun-sen line also lies, before making attempts to reach the 1.3033 boundary. Should the bulls persist, the 50-day SMA at 1.3068 could impede buyers from challenging the 100-day SMA, attached under the 1.3172 high, which is also in-line with the cloud’s upper surface.
In brief, USDCAD’s dictating bearish bias appears to have stalled temporarily above the 1.2700 handle. Nonetheless, the negative pressures at work seem to command underneath the SMAs and the 1.3172 high.


