
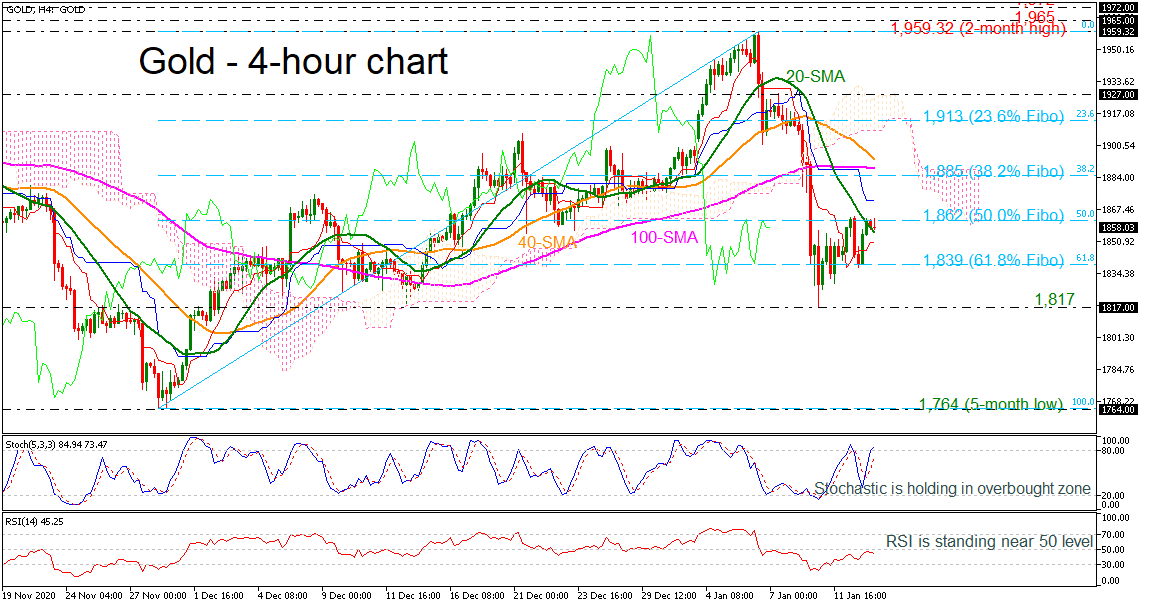
Gold prices found significant resistance around the 50.0% Fibonacci retracement level of the upward wave from 1,764 to 1,959.32 at 1,862, holding marginally above the 20-period simple moving average in the 4-hour chart.
According to the technical indicators, the stochastic is looking overbought, as the %K line jumped above the 80 level after a bullish cross with the %D line. Moreover, the RSI is flattening around the 50 level, confirming the recent neutral bias on price.
Should the precious metal make another run higher, it’s likely to meet resistance at the 38.2% Fibonacci of 1,885 ahead of the 100-period SMA at 1,889 and 1,892. A successful break above these key levels would open the way for the 23.6% Fibonacci of 1,913.
If the soft positive momentum fails to hold and prices turn lower, the red Tenkan-sen line at 1,850 is the nearest support that could halt steeper declines. A potentially more important support, though, is the 61.8% Fibonacci of 1,839 before touching the 1,817 barrier. If breached, it would shift the focus to the downside and prices would slip towards the five-month low of 1,764.
In the bigger picture, gold would need to make a sustained climb above the two-month high of 1,959.32 in order for the outlook to become convincingly bullish.


")


