
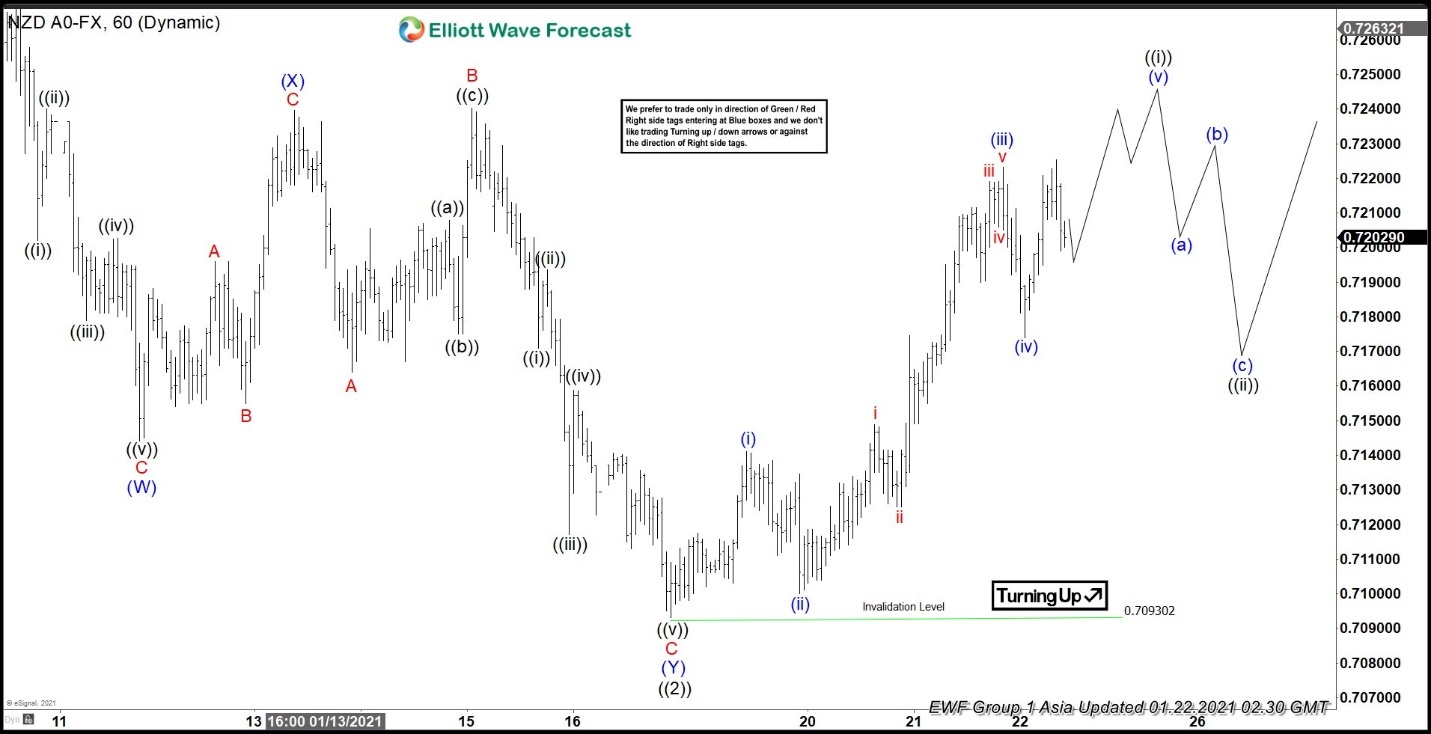
Short Term Elliott Wave view in NZDUSD suggests the pair ended wave ((2)) pullback at 0.7093. This pullback ended correction of the cycle from September 24 low. Internal of wave ((2)) unfolded as a double three Elliott Wave structure. Wave (W) ended at 0.7144, wave (X) ended at 0.7239, and wave (Y) of ((2)) ended at 0.7093. Pair has started to turn higher in wave ((3)). However, it still needs to break above wave ((1)) at 0.7315 to rule out a double correction.
Up from wave ((2)) low at 0.7093, wave (i) ended at 0.7141, and pullback in wave (ii) ended at 0.71. Wave (iii) higher ended at 0.7223, and pullback in wave (iv) ended at 0.7174. Pair can now either extend higher a little more to end wave (v) of ((i)) or it could also have ended wave ((i)) at 0.7225. Either way, expect pair to end wave ((i)) soon. Afterwards, it should pullback in wave ((ii)) to correct cycle from January 18 low before the rally resumes. As far as wave ((2)) low pivot at 0.7093 low stays intact, expect dips to find support in 3, 7, or 11 swing for more upside.
NZDUSD 60 Minutes Elliott Wave Chart


