
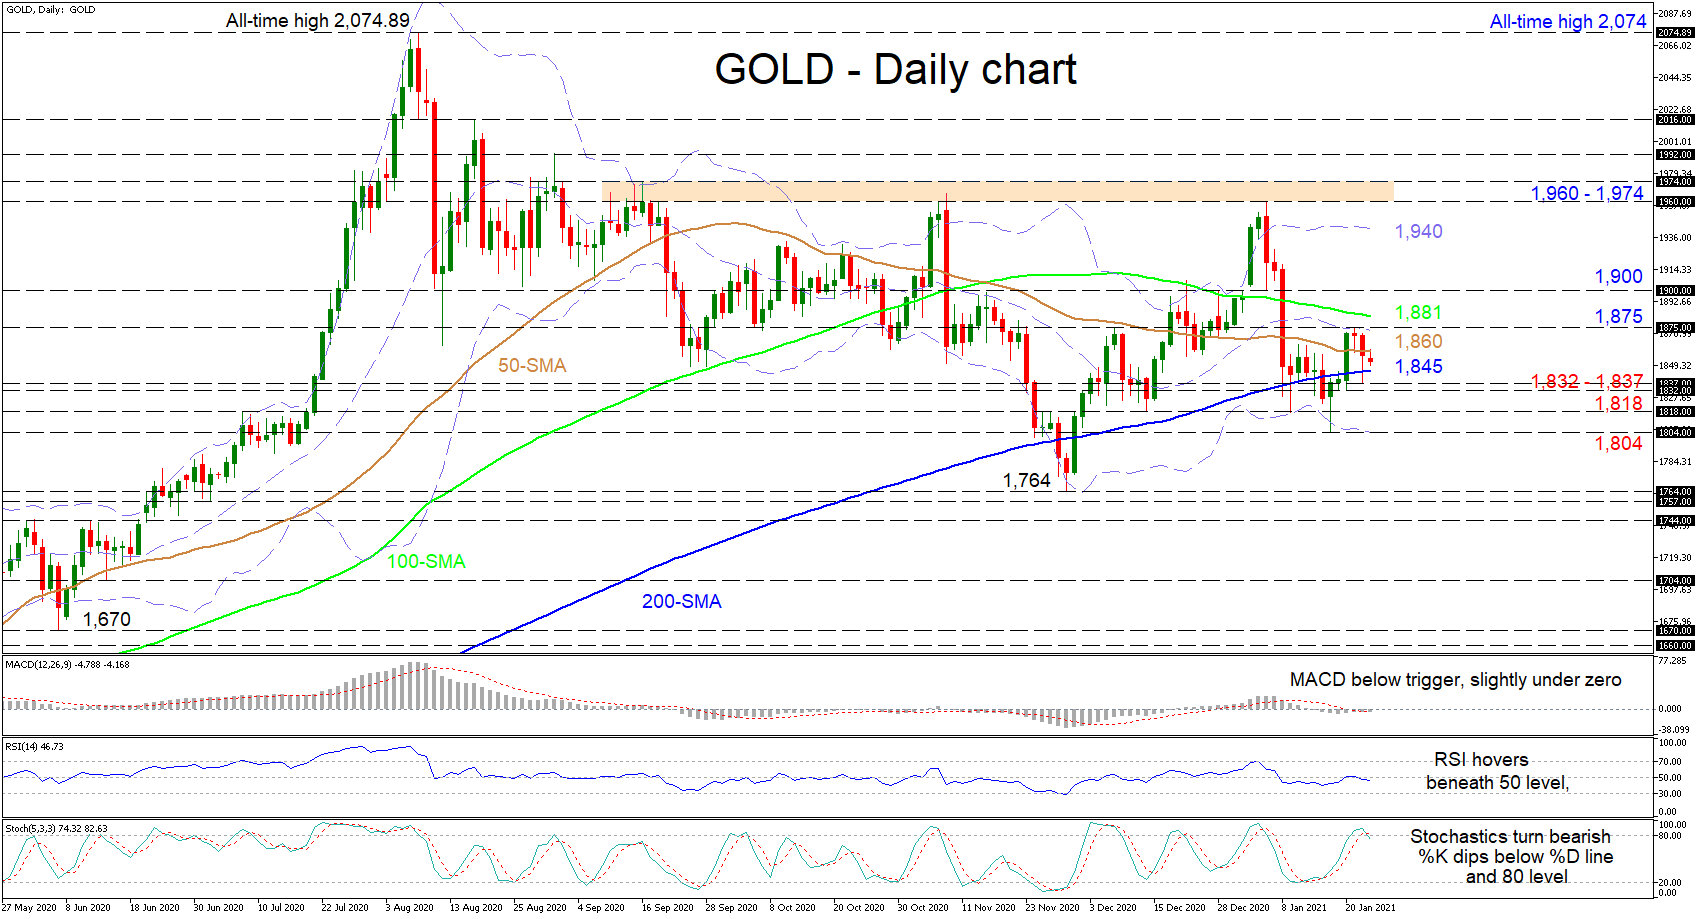
Gold is consolidating around its 200-day simple moving average (SMA), after recently collapsing from the resistance ceiling of 1,960-1,974, which has been curbing gains since early September 2019. The converging SMAs and their fairly reduced gradients are fuelling a more neutral demeanour in the commodity.
The short-term oscillators are suggesting directional momentum has somewhat dried up but are leaning ever so slightly towards the downside. The MACD, marginally underneath zero, is merely below its red trigger line, while the RSI is floating beneath its neutral threshold, looking set to deteriorate further. Furthermore, the stochastic oscillator has turned bearish and is endorsing additional dwindling in price.
If sellers gain strength, immediate downside constrictions may arise from the critical 200-day SMA at 1,845 ahead of an adjacent support band of 1,832-1,837. Sliding below this boundary, the yellow metal could meet the 1,818 barrier before challenging the 1,804 trough, reinforced by the lower Bollinger band.
However, if buyers manage to drive the price above the capping 50-day SMA at 1,860, subsequent tough resistance may develop at the mid-Bollinger band, residing at the 1,875 high. Overrunning this, the price then faces the nearby 100-day SMA at 1,881, which may impede the commodity from targeting the critical 1,900 mark. Yet, should additional gains unfold, the precious metal may propel towards the upper Bollinger band at 1,940.
Overall, in the short-term picture price action appears confined to the region between the mid- and lower Bollinger bands. A dive below 1,804 may trigger stronger negative tendencies, while a shift above 1,900 could inject confidence into the commodity.


 Is Testing an Important Resistance Zone")