
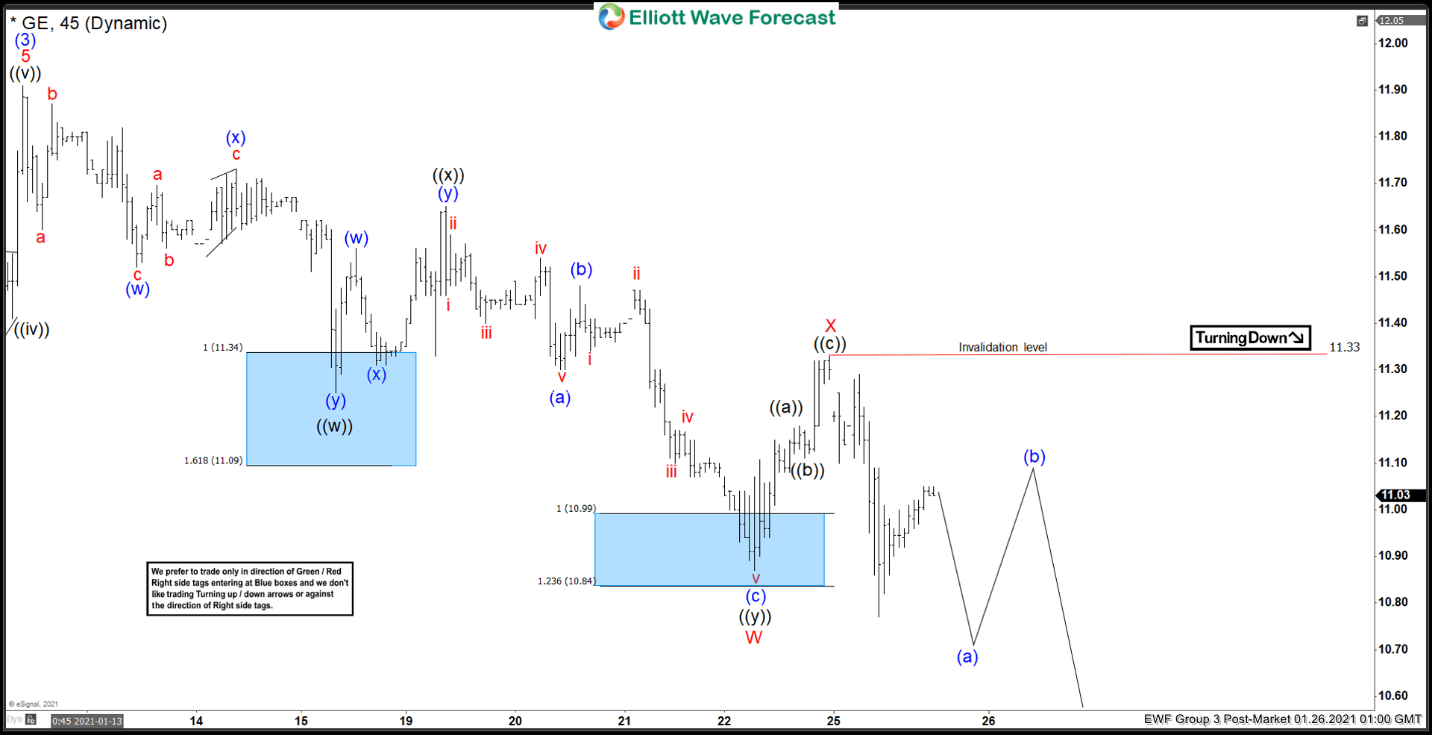
Short Term Elliott Wave view in General Electric (ticker: GE) suggests the rally to January 13 high at $11.91 ended wave (3). The stock is now in wave (4) pullback and the internal is unfolding as a double three Elliott Wave structure. Down from wave (3) peak, wave ((w)) ended at $11.25, bounce in wave ((x)) ended at $11.65, and wave ((y)) lower ended at $10.87. This completed wave W in higher degree.
Stock then bounced in wave X which ended at $11.33 as a zigzag Elliott Wave structure. Up from wave W at $10.87, Wave ((a)) ended at $11.18, and wave ((b)) pullback ended at $11.11. Wave ((c)) higher ended at $11.33, which completed wave X. GE then turned lower and broke below wave W at $10.87, suggesting the next leg lower has started. Near term, while rally fails against $11.33 in the first degree, expect further downside in the stock. Potential target lower in wave (4) is 100% – 161.8% Fibonacci extension from January 13 peak which comes at $9.65 – $10.29. Once the stock completes wave (4) pullback, it can then resume higher again in wave (5) to a new high above wave (3) at $11.91.
General Electric (GE) 45 Minutes Elliott Wave Chart


