
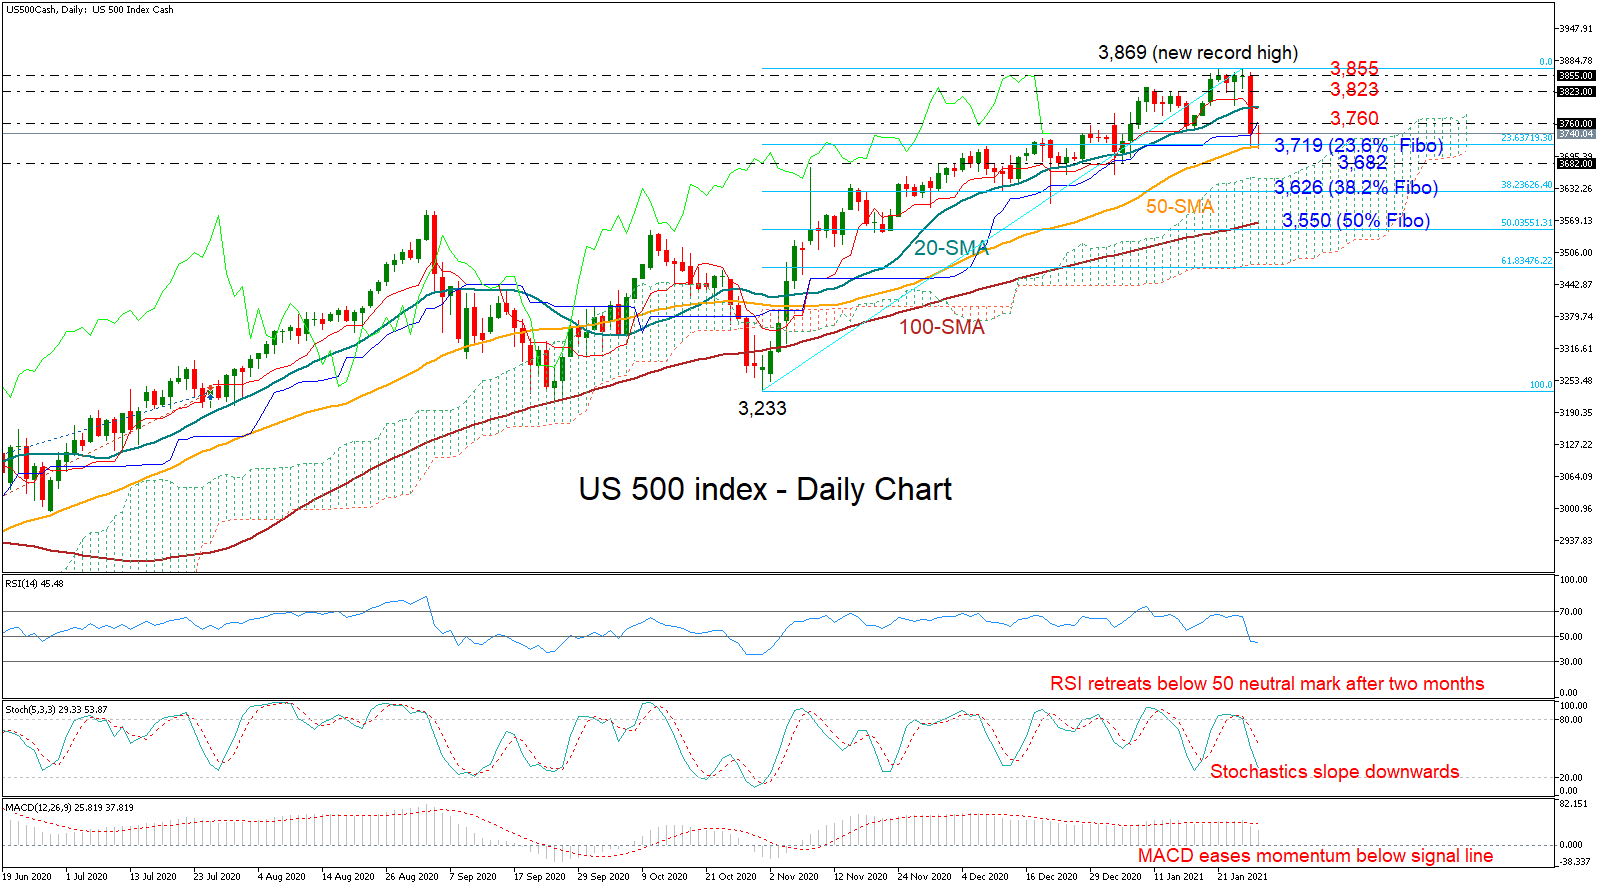
The US 500 stock index (cash) erased January’s gains in one day and slumped to a three-week low of 3,711 after the 3,855 bar proved to be a tough resistance to overcome. That was the biggest daily loss since June 12.
The touch with the 50-day simple moving average (SMA) brought the calm after the storm near the 23.6% Fibonacci retracement of the 3,233 – 3,869 upleg. However, given the negative slope in the RSI, which has dipped below its 50 neutral mark, and the weakness in the MACD and the Stochastics, the bearish cycle seems to be still in action.
Unless the 50-day SMA creates a sturdy base around 3,719, the index may ease to test the 3,682 barrier. Beneath that, the decline could get new legs towards the 38.2% Fibonacci of 3,626, where any violation would open the door for the 100-day SMA and the 50% Fibonacci of 3,550.
Alternatively, if the bulls set a foothold above the nearby resistance of 3,760, where the blue Kijun-sen line is placed, they could re-challenge the 3,823 – 3, 855 restrictive region if the 20-day SMA at 3,790 gives way as well.
Meanwhile in the bigger picture, the structure of higher highs and higher lows remains intact despite Monday’s downfall. A decisive close below 3,600 is required for the positive outlook to switch to neutral.
Summarizing, the US 500 index seems to be exposed to additional downside movements, where a decisive close below 3,715 is expected to trigger the next bearish action.


