
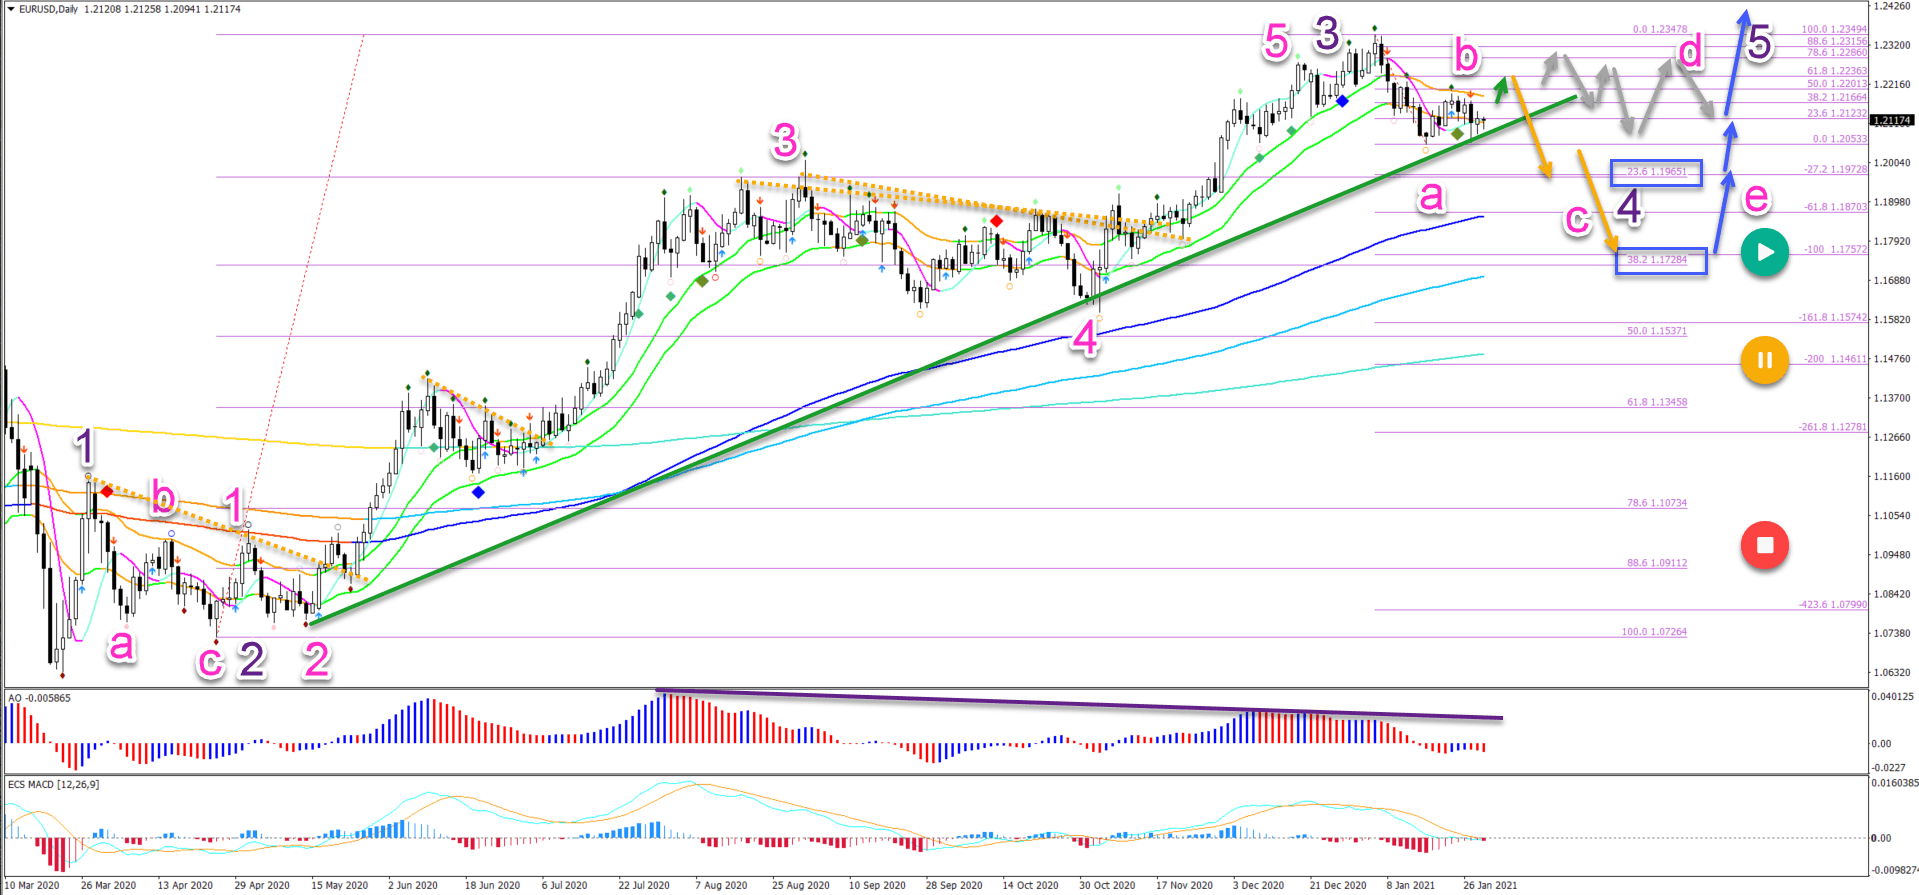
EUR/USD is building a bearish pullback within the long-term uptrend. Price action is expected to build either an ABC or ABCDE triangle pattern (pink) on the daily chart.
The EUR/USD seems to have completed a wave 3 (purple) at the recent high. This means that the current pullback is likely a wave 4 (purple).
On the 4 hour chart, the bearish price action respected the previous bottom and made a bullish bounce. This seems to confirm a bullish ABC (orange) in wave B (grey).
This article reviews what price movement to expect during the pullback. We also analyse the key support and resistance zones.
Price Charts and Technical Analysis
- Waves 4 are usually shallow retracements.
- An ABC zigzag could take price down quite soon (orange arrows).
- A sideways correction could be an ABCDE pattern (grey arrows).
- Waves 4 respect the 38.2% Fibonacci retracement level most of the time.
- Other key levels are the 23.6% and 50% Fibonacci levels.
- These Fib levels are expected to act as support (blue boxes).
- They could also create a larger bounce for an uptrend continuation (blue arrows).
Only a break below the 50% Fib would put the uptrend on hold (yellow circle). An even deeper retrace would invalidate it (red circle).
A break above the 21 ema zone could confirm a 5 wave (orange) pattern up in wave C (grey) to complete wave B (pink).
A bearish bounce at or below the 61.8% Fibonacci level makes a bearish ABC zigzag more likely. A deeper retracement towards the 78.6% Fib or higher makes an ABC flat or ABCDE triangle more likely (light green letters). 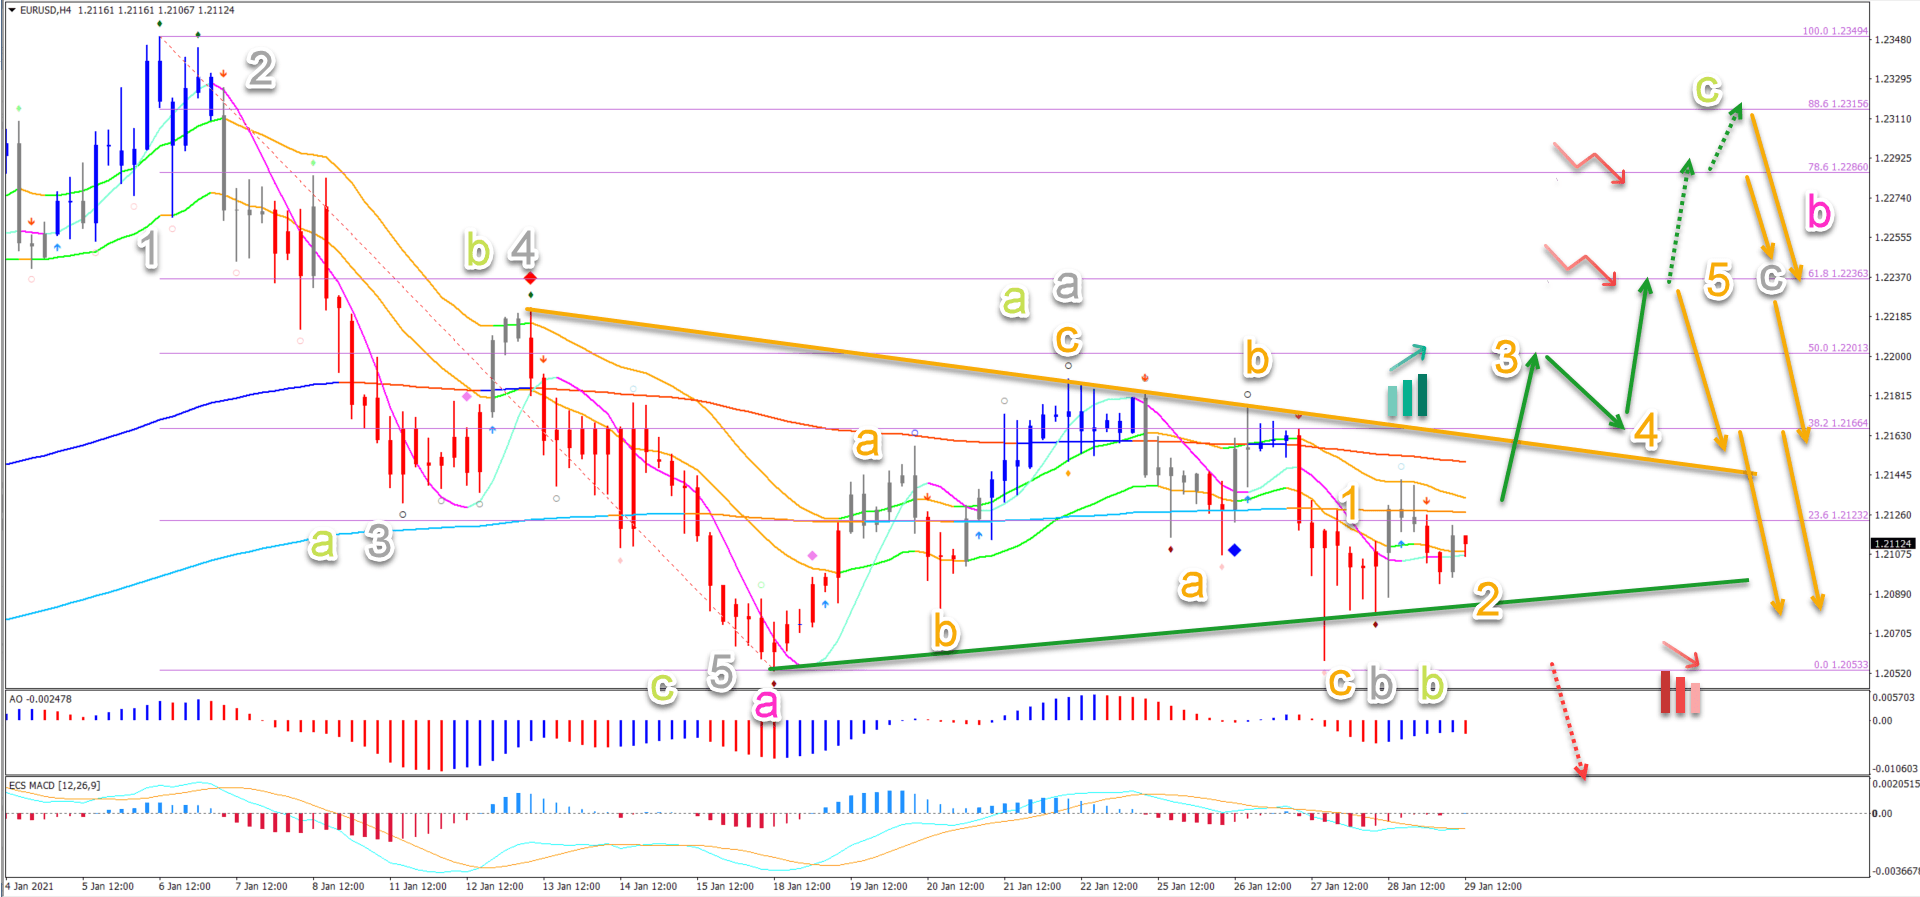


