
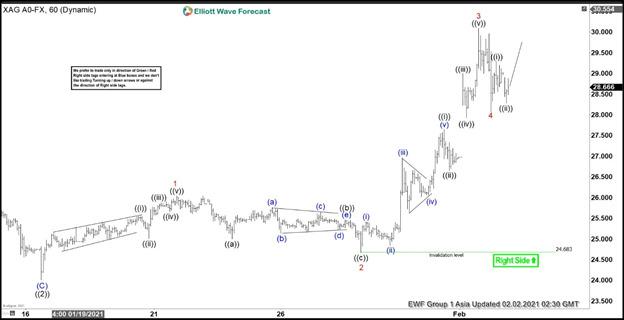
Silver has made a new 52 week high this week suggesting last year’s correction is over. From the 60 minutes chart below, we can see the rally from January 18 low is unfolding as a 5 waves impulsive Elliott Wave structure. Up from wave ((2)) low on January 18, wave ((i)) ended at 25.56, and pullback in wave ((ii)) ended at 25.01. Wave ((iii)) ended at 25.9, wave ((iv)) ended at 25.67 and wave ((v)) ended at 26.04. This completed wave 1 in higher degree.
Silver then pullback in wave 2 which ended at 24.68. Internal subdivision of wave 2 unfolded as a zigzag structure where wave ((a)) ended at 25, wave ((b)) ended at 25.46, and wave ((c)) ended at 24.67. Silver continued to rally higher in wave 3 towards 30.09 as another impulse in lesser degree. Up from wave 2 low, wave ((i)) ended at 27.65, wave ((ii)) ended at 26.65, wave ((iii)) ended at 29.01, wave ((iv)) ended at 27.93, and wave ((v)) ended at 30.09. Pullback in wave 4 is now proposed complete at 28.07, but silver still needs to break above wave 3 at 30.09 to rule out a double correction.
If Silver breaks below 28.07, then wave 4 remains in progress as a double three and can see further downside to 26.04 – 27.2 before finding buyers. As far as pivot at 24.68 low stays intact, expect dips to find support in 3, 7, or 11 swing for more upside.
Silver 60 Minutes Elliott Wave Chart


 Looking to Extend Higher in a Nest")


