
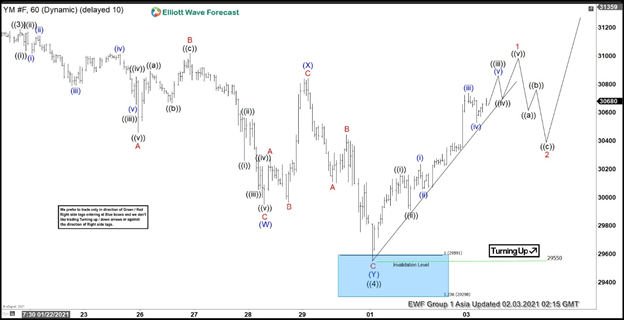
Cycle from March 2020 low in Dow Futures (YM_F) still remains intact as a diagonal 5 waves. In the 60 minutes chart below, we can see wave ((3)) of the diagonal ended at 31188. Wave ((4)) pullback is proposed complete at 29550 as a double zigzag Elliott Wave structure. Down from wave ((3)) high, wave A ended at 30457, bounce in wave B ended at 31017, and wave C ended at 29950. This first zigzag structure completed wave (W). Index then rallied in wave (X) towards 30843 before turning lower again in wave (Y) towards 29550 as the second zigzag. Down from wave (X) high, wave A ended at 30104, wave B ended at 30443, and wave C completed at 29550. This completed wave (Y) of ((4)) in larger degree.
Index has now started wave ((5)) higher. However, it still needs to break above wave ((3)) high at 31188 to rule out a double correction. Up from wave ((4)) low, wave ((i)) ended at 30164, and pullback in wave ((ii)) ended at 29907. Expect Index to see two more highs before ending wave 1 of ((5)). It should then pullback in wave 2 to correct the cycle from February 1 low before the rally resumes. As far as pivot at 29550 low stays intact, expect dips to find support in 3, 7, or 11 swing for more upside.
Dow Futures (YM_F) 60 Minutes Elliott Wave Chart


