
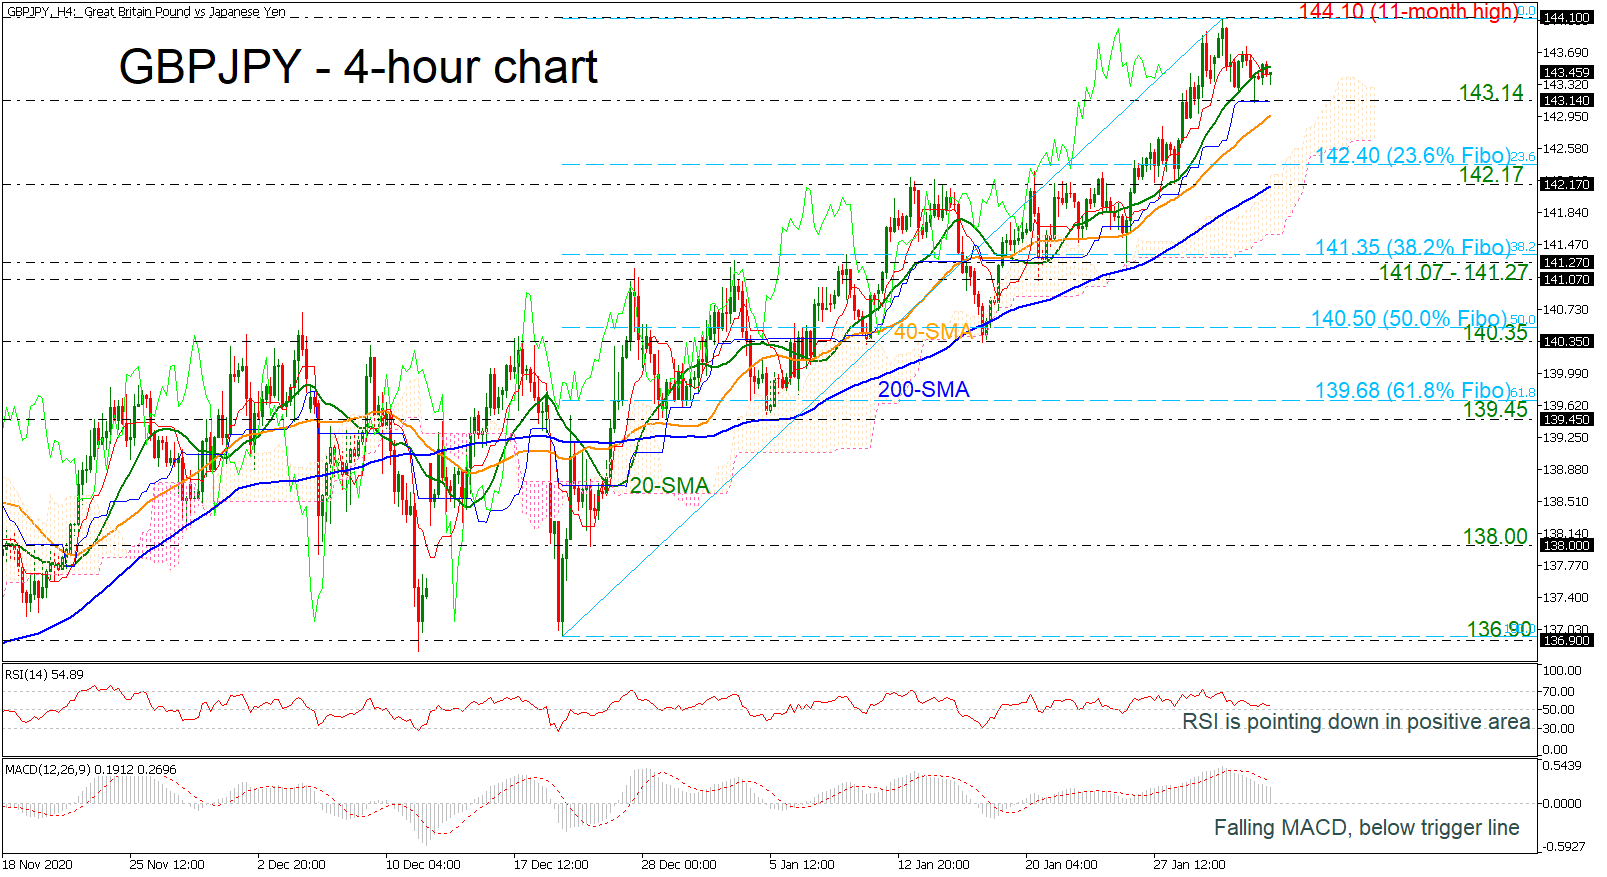
GBPJPY has been in a declining move over the last couple of days, after the upside rally towards the more than eleven-month high of 144.10. The price was capped by the 20-period simple moving average (SMA) in the 4-hour chart, while the technical indicators are confirming the recent bearish structure. The RSI is moving south in the positive region, while the MACD is standing beneath its trigger line and above the zero area.
If selling interest persists, immediate support could come from the 143.14 barrier, near the Ichimoku cloud and slightly above the 40-period SMA at 143.00. Beneath these lines, the 23.6% Fibonacci retracement level of the up leg 136.90 to 144.10 at 142.40 could come next ahead of the 200-day SMA at 142.17.
Alternatively, a bounce off the 143.14 support could move the market higher again towards the eleven-month peak of 144.10. Steeper increases could meet the 145.00 psychological level, registered on February 2020.
In conclusion, GBPJPY is still in a bullish tendency and only a significant drop below the 200-period SMA may change this outlook to neutral.


