
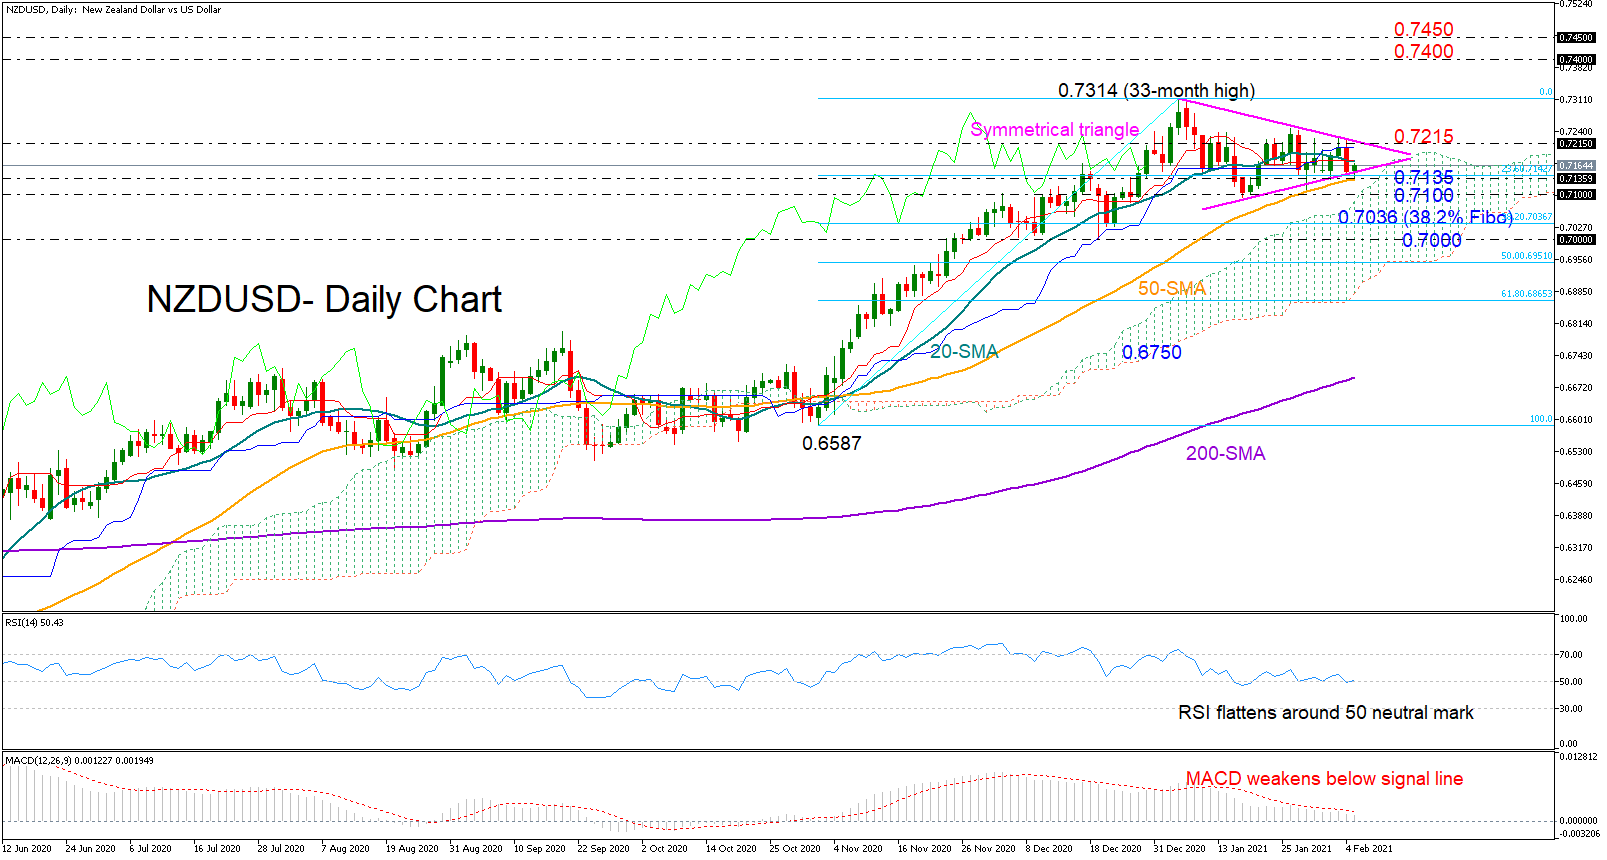
NZDUSD continues its consolidation phase inside a symmetrical triangle and below the 33-month high of 0.7314.
While the price is looking set for another rebound within the formation and near the 50-day simple moving average (SMA), the momentum indicators provide little hope for cheer. The RSI is muted around its 50 neutral mark, and the MACD is gradually diminishing below its red signal line, while the red Tenkan-sen remains flattish slightly below the blue Kijun-sen line.
A move above the 20-day SMA at 0.7173 could see an extension towards the surface of the triangle seen around 0.7215, where a successful breakout is expected to pick up steam towards the top of 0.7314. If buying pressure strengthens further, the 0.7400 – 0.7450 region may attempt to halt the rally ahead of the 0.7500 number.
Alternatively, if the price slips below the triangle and the 50-day SMA at 0.7135, the 0.7100 round-level and the surface of the Ichimoku cloud could immediately come to the rescue. Failure to hold above that base could trigger a more aggressive downfall until the 0.7036 – 0.7000 support region, where the 38.2% Fibonacci level of the November – January up leg is located. Such a decline would also put the upward trend in jeopardy. Perhaps a bearish cross between the 20- and 50-day SMAs could further promote a trend deterioration.
In brief, NZDUSD is maintaining a neutral tone within a symmetrical triangle in the short-term picture, likely waiting for a close above 0.7215 or below 0.7135 to get into action.


