
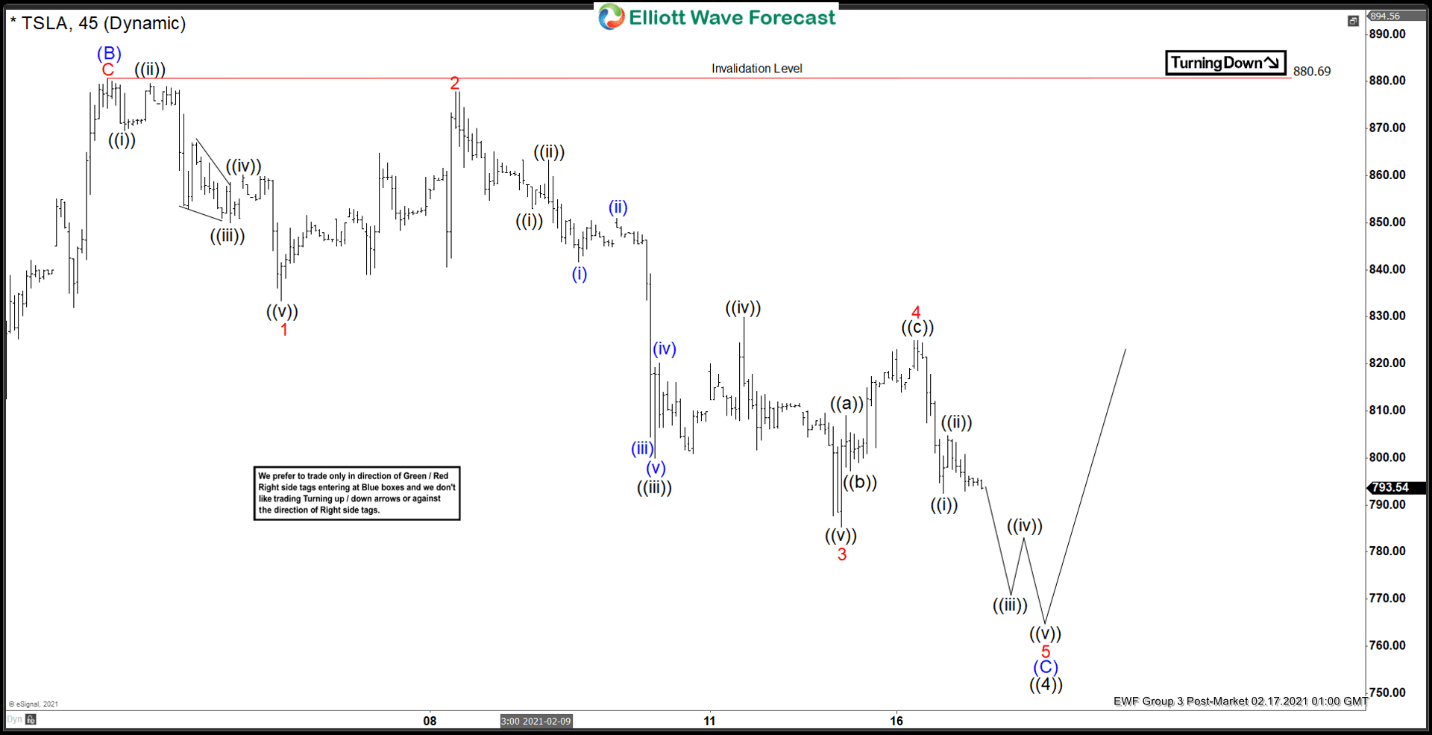
After forming the peak on January 25 at 900.4, Tesla (TSLA) has spent a month consolidating. The decline from January 25 high is unfolding as a zigzag Elliott Wave structure where wave (A) ended at 780.1 and wave (B) bounce ended at 880.69 as seen in the chart below. The stock is now finishing up wave (C) with the internal subdivision unfolding as a 5 waves impulse. Down from wave (B), wave ((i)) ended at 869.55 and bounce in wave ((ii)) ended at 879.64. The stock then resumed lower in wave ((iii)) towards 850 and bounce in wave ((iv)) ended at 860.23. Final leg lower in wave ((v)) ended at 833.42 and this completed wave 1 in higher degree.
Tesla then rallied in wave 2 which ended at 877.88. Stock then resumed lower in wave 3 which ended at 785.33 with internal subdivision as another impulse. Down from wave 2, wave ((i)) ended at 853, wave ((ii)) ended at 863.4, wave ((iii)) ended at 800.02, wave ((iv)) ended at 829.88, and wave ((v)) of 3 ended at 785.33. Wave 4 bounce is now proposed complete at 825. and while below there, and more importantly below 880.69, the stock has scope to extend lower to complete wave 5 of (C). Potential target lower is 100% – 161.8% Fibonacci extension from January 25 high which comes at 687.8 – 761.4. From this area, expect buyers to appear and the stock to resume to new high or at least bounce in 3 waves.
Tesla (TSLA) 1 Hour Elliott Wave Chart


