
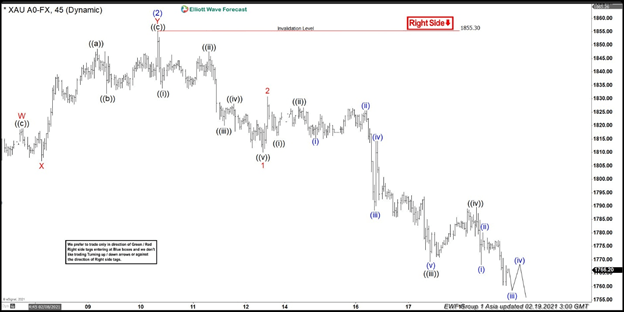
Gold has been consolidating for 6 months after forming the top at $2075 on August 2020 and the low at $1764 on November 2020. Today, the metal has finally broken out of the range to the downside. This suggests the weakness in the metal should continue in the near term. 45 Minutes chart in Gold below shows the rally to $1855.3 ended wave (2).
Gold thus is within wave (3) lower with internal subdivision as an impulse Elliott Wave structure. Down from wave (2), wave ((i)) ended at 1833.9, and bounce in wave ((ii)) ended at 1847.54. The metal then resumed lower in wave ((iii)) towards 1820 and bounce in wave ((iv)) ended at 1828.01. Final leg lower in wave ((v)) ended at 1810 and this completed wave 1 in higher degree. The metal then bounced in wave 2 which ended at 1830.076. The metal has resumed lower again in wave 3. Down from wave 2, wave ((i)) ended at 1816.2, wave ((ii)) ended at 1827.04, wave ((iii)) ended at 1769.3 and wave ((iv)) ended at 1789.63. As far as February 10 pivot at 1855.3 remains intact, Gold has scope to extend lower towards 1602 – 1739 area where support can be seen for larger 3 waves bounce at least.
Gold (XAU/USD) 45 minutes Elliott Wave chart


