
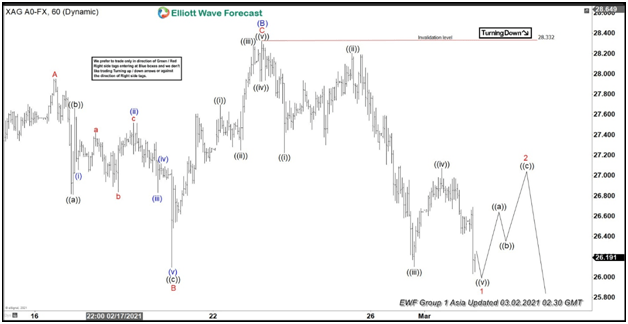
Silver (XAGUSD) formed a high on February 1 at $30.09 during the reddit #silversqueeze event. Since then, the metal has continued to pullback. The decline from February 1 peak is progressing as a zigzag Elliott Wave structure where wave (A) ended at $25.87, and wave (B) ended at $28.33. Internal of wave (B), as seen in the 1 hour chart below, unfolded as a Flat correction. Up from wave (A), wave A ended at $27.95, wave B ended at $26.09, and wave C of (B) ended at $28.32.
Wave (C) lower now remains in progress as a 5 waves impulse. Down from wave (B), wave ((i)) ended at $27.22 and bounce in wave ((ii)) ended at $28.2. The metal then resumed lower in wave ((iiii)) which ended at $26.1, and wave ((iv)) ended at $27.07. Expect wave ((v)) to end soon and this should complete wave 1 in larger degree. Afterwards, expect Silver to rally in wave 2 to correct the decline from February 23 high (28.3) before it turns lower again. As far as pivot at 28.3 high stays intact, near term rally can fail and Silver has scope to extend lower to end wave (C) from February 1. Potential support area is 100% – 161.8% Fibonacci extension from February 1 peak which comes at $21.4 – $24.07.
XAG/USD (silver) 60 minutes Elliott Wave chart


 Looking to Extend Higher in a Nest")


