
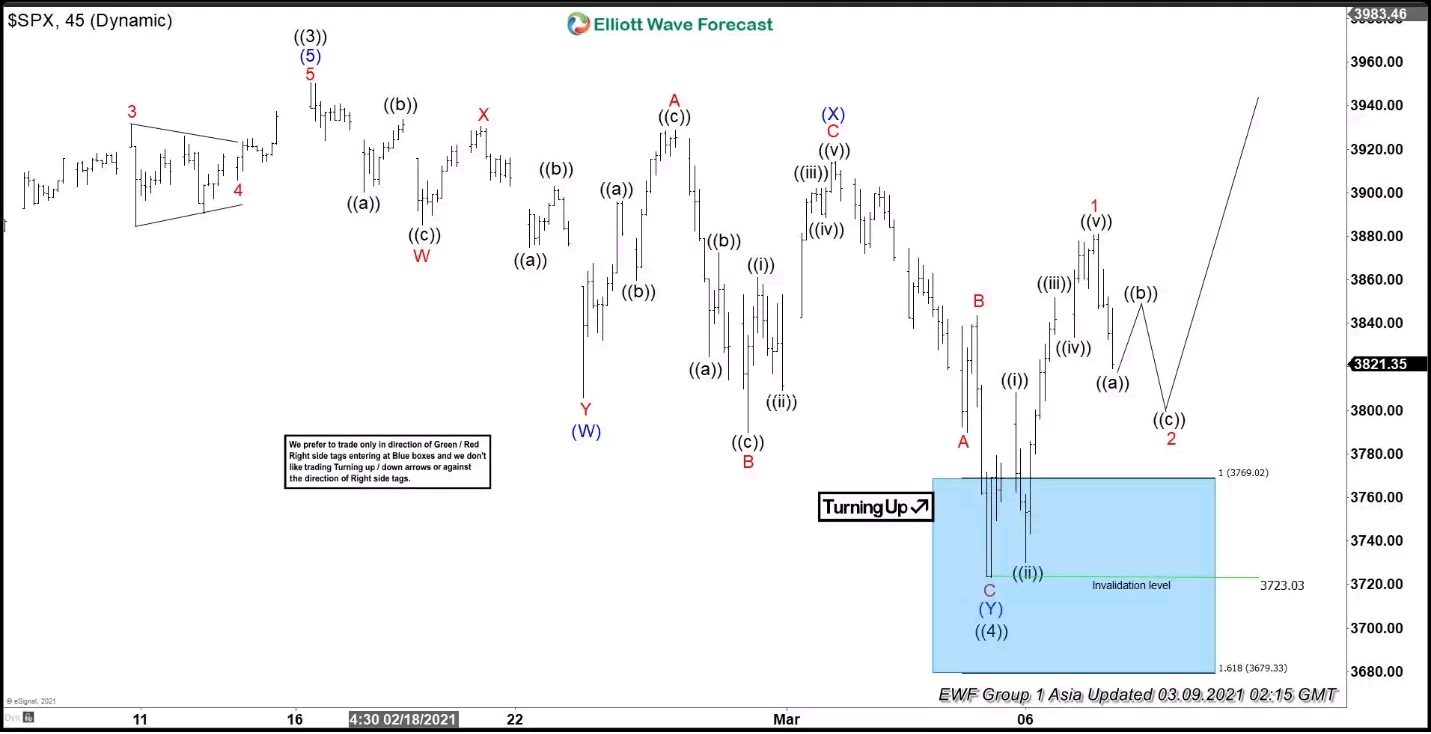
Elliott Wave View suggests that since forming the low in March 2020, S&P E-Mini Futures (ES) has rallied in an impulse Elliott Wave structure. Rally to 3959.25 ended wave ((3)) and pullback in wave ((4)) is proposed complete at 3721.55 as a double three structure. Down from wave ((3)), wave (W) ended at 3804.75, rally in wave (X) ended at 3934.50, and decline to 3721.55 ended wave (Y). Index ended wave ((4)) at the 100% – 161.8% Fibonacci extension from wave ((3)) high at 3683.81 – 3779.53 blue box area.
Index has since rallied higher from the blue box area in wave ((5)). However, it still needs to break above wave ((3)) high at 3959.25 to rule out a double correction in wave ((4)). Up from wave ((3)), wave ((i)) ended at 3814.50 and pullback to wave ((ii)) ended at 3728.50. Index then rallied higher again in wave ((iii)) towards 3866.25 and pullback in wave ((iv)) ended at 3796.25. Final leg higher wave ((v)) ended at 3878.75 which also completed wave 1. Near term, while pullback stays above March 5 low (37321.5) in the first degree, expect dips to find support for more upside.
S&P 500 E-Mini Futures (ES) 45 Minutes Elliott Wave Chart


