
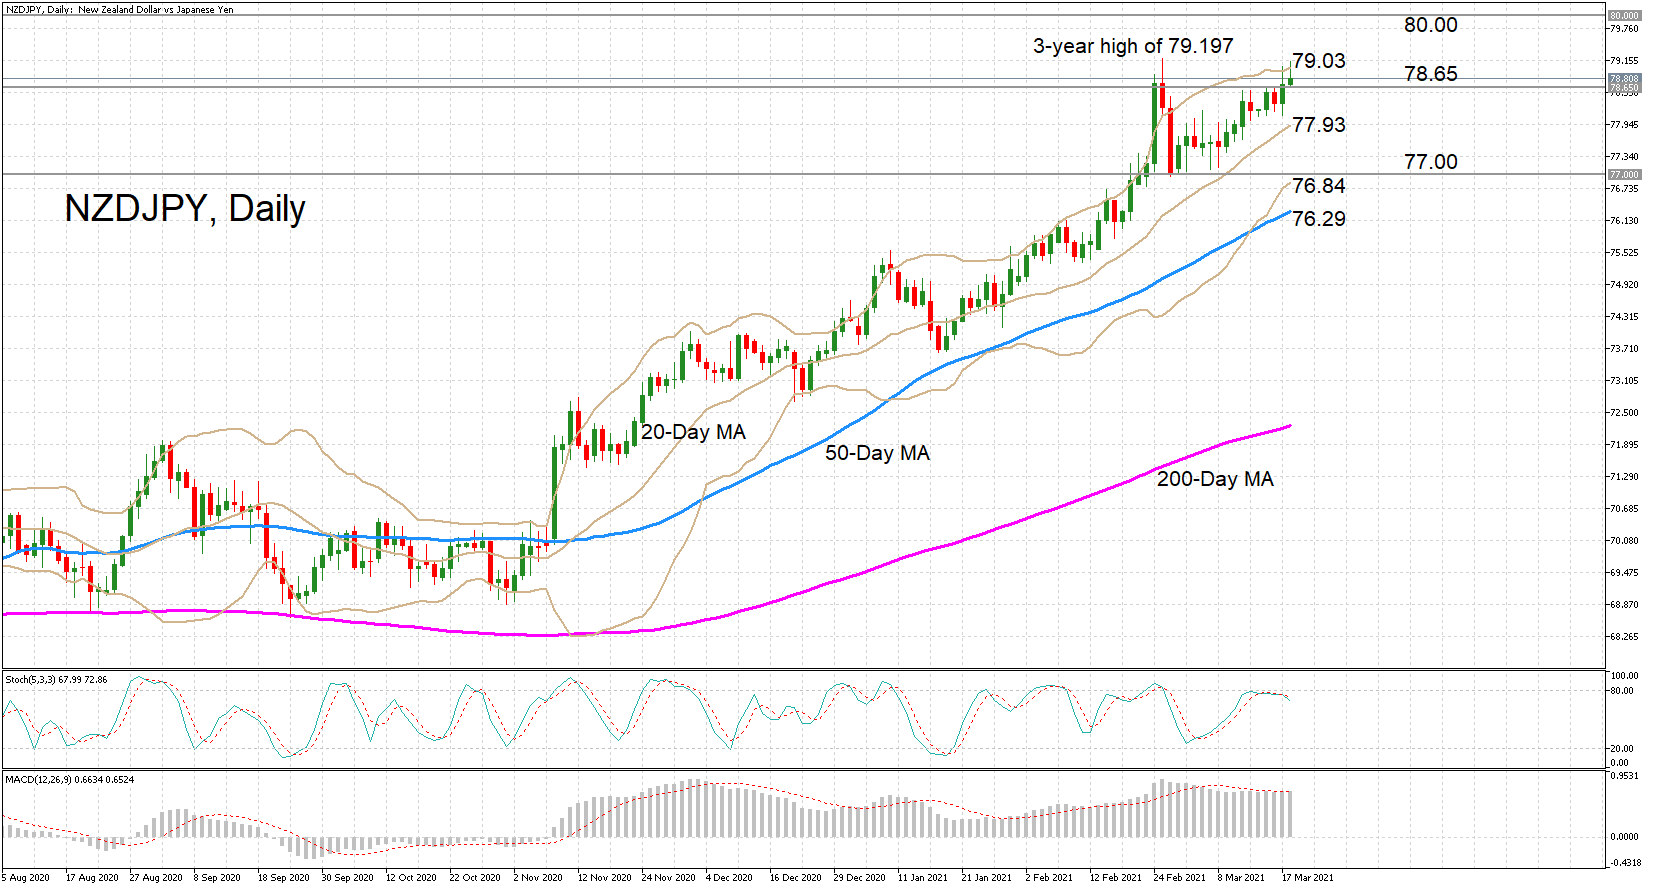
NZDJPY is testing the upper Bollinger band around 79 after successfully cracking the recently formed ceiling of 78.65. Nevertheless, momentum indicators have receded slightly in recent days. The fast-moving %K line of the stochastic oscillator has slipped below the %D line, signalling some price weakness in the coming sessions. However, the fact that they haven’t managed to rise above the 80 overbought mark in the latest upswing has left the door open for another attempt to climb above it.
In the meantime, the MACD could be at a turning point, as its histogram has started to cross back above the red signal line, suggesting the positive momentum could be picking up again.
Should prices continue to drift lower, the 20-day moving average (MA), which is also the middle Bollinger band, could prevent any declines below 77.93. If sellers prevail, the previously proven 77 support level could stem steeper losses. But should this floor be breached too, the lower Bollinger band at 76.84 and the 50-day MA at 76.29 would be the only barriers standing in the way of the medium-term positive outlook switching to a more neutral one.
On the flip side, NZDJPY needs to overcome the immediate resistance of the upper Bollinger band at 79.03 if the bullish bias is to hold. But for more sustained gains, the pair would have to surpass the 3-year peak of 79.197 scaled on February 25. Above that top, the 80 level would increasingly come into focus as the next major target for the bulls.
In the short term, the positive picture is on shaky grounds unless the pair can extend its gains above the 79 level. But the longer-term uptrend should stay intact as long as the price action holds above the 50-day MA.


