
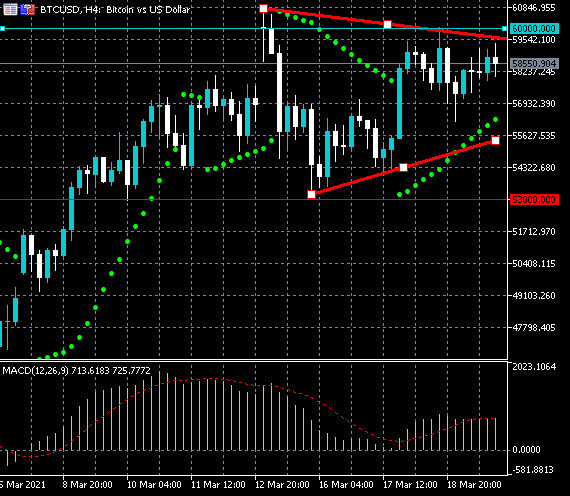
Bitcoin is trapped inside a symmetrical triangle pattern between the $59,500 and $55,600 levels as the top crypto consolidates towards the top-end of its trading range. Looking at the size of the pattern, a $4,000 directional move could take place once a breakout from the triangle occurs. A strong intraday bullish bias is in play while the BTCUSD pair trades above the February monthly high, around $58,360.
The BTCUSD pair is only bullish while trading above the $58,360 level, key resistance is found at the $59,500 and the $63,000 levels.
If the BTCUSD pair trades below the $58,360 level, sellers may test the $55,600 and $53,000 levels.


