
Key Highlights
- GBP/USD retested the 1.3670 support zone and it is likely forming a double bottom pattern.
- A key bearish trend line is forming with resistance near 1.3860 on the 4-hours chart.
- EUR/USD remains well bid above the main 1.1850 support zone.
- The UK GDP could grow 0.6% in Feb 2021 (MoM), up from the last -2.9%.
GBP/USD Technical Analysis
This past week, the British Pound topped above 1.3800 and declined steadily against the US Dollar. GBP/USD even broke the 1.3750 support to move into a bearish zone.
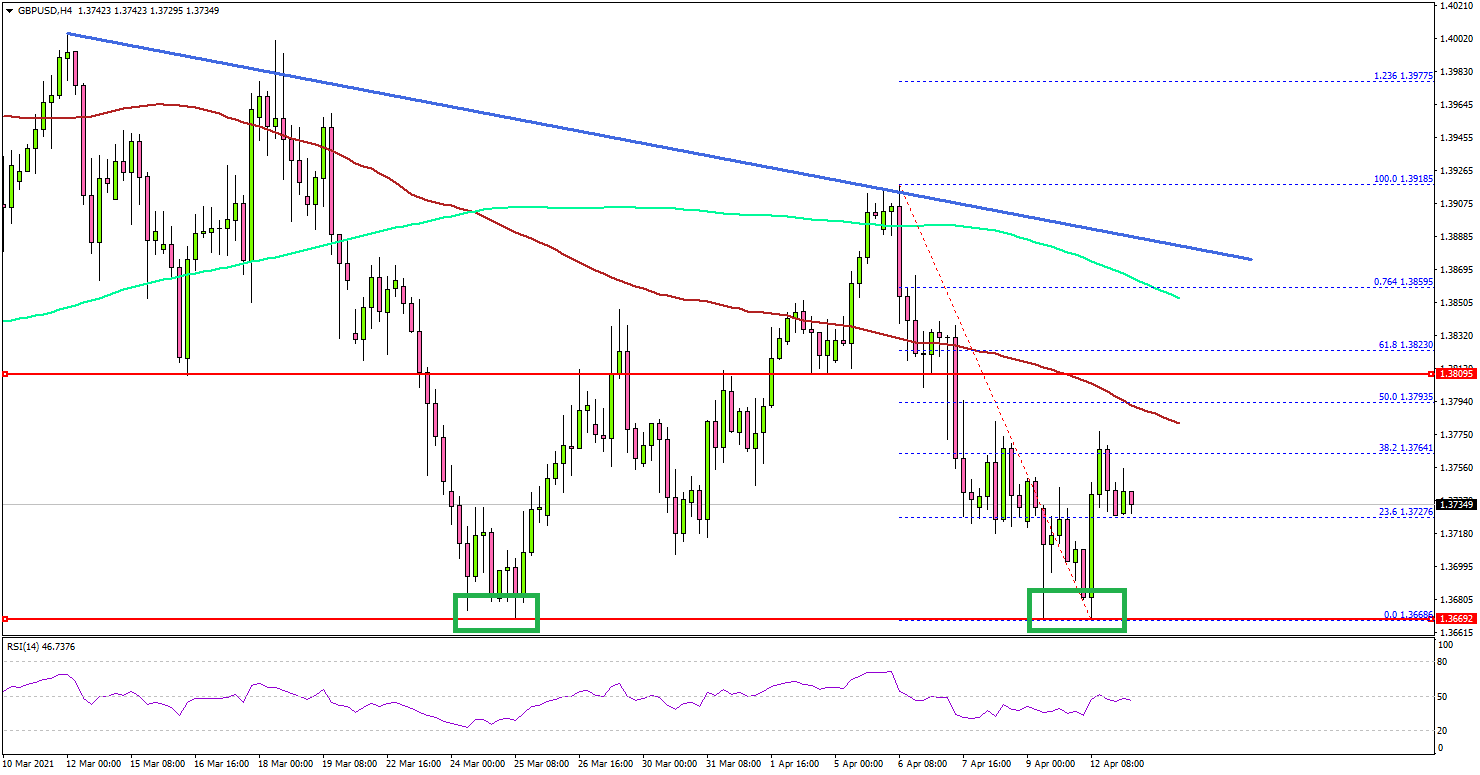
Looking at the 4-hours chart, the pair settled below the 1.3800 level and the 100 simple moving average (red, 4-hours). However, it retested the main 1.3670 support zone, where the bulls took a strong stand.
It seems like the pair is likely forming a double bottom pattern near the 1.3670 level. On the upside, the first key resistance is near the 1.3800 level and the 100 simple moving average (red, 4-hours). It is close to the 50% Fib retracement level of the downward move from the 1.3918 high to 1.3668 low.
The next major resistance is near the 1.3850 level and the 200 simple moving average (green, 4-hours). A successful break above the 1.3800 and 1.3850 levels could validate the double bottom pattern. In the stated case, the pair could rise towards the 1.3950 level.
Conversely, there could be a fresh decline below the 1.3700 level. The main breakdown support is at 1.3670, below which the pair could nosedive.
Looking at EUR/USD, the pair remained well bid above the 1.1850 and 1.1825 support levels. Conversely, USD/JPY failed to surpass 110.00 and corrected lower.
Economic Releases
- UK Industrial Production for Feb 2021 (MoM) – Forecast +0.5%, versus -1.5% previous.
- UK Manufacturing Production for Feb 2021 (MoM) – Forecast -0.8%, versus -2.3% previous.
- UK GDP for Feb 2021 (MoM) – Forecast +0.6%, versus -2.9% previous.
- US Consumer Price Index for March 2021 (MoM) – Forecast +0.5%, versus +0.4% previous.
- US Consumer Price Index for March 2021 (YoY) – Forecast +2.5%, versus +1.7% previous.


