
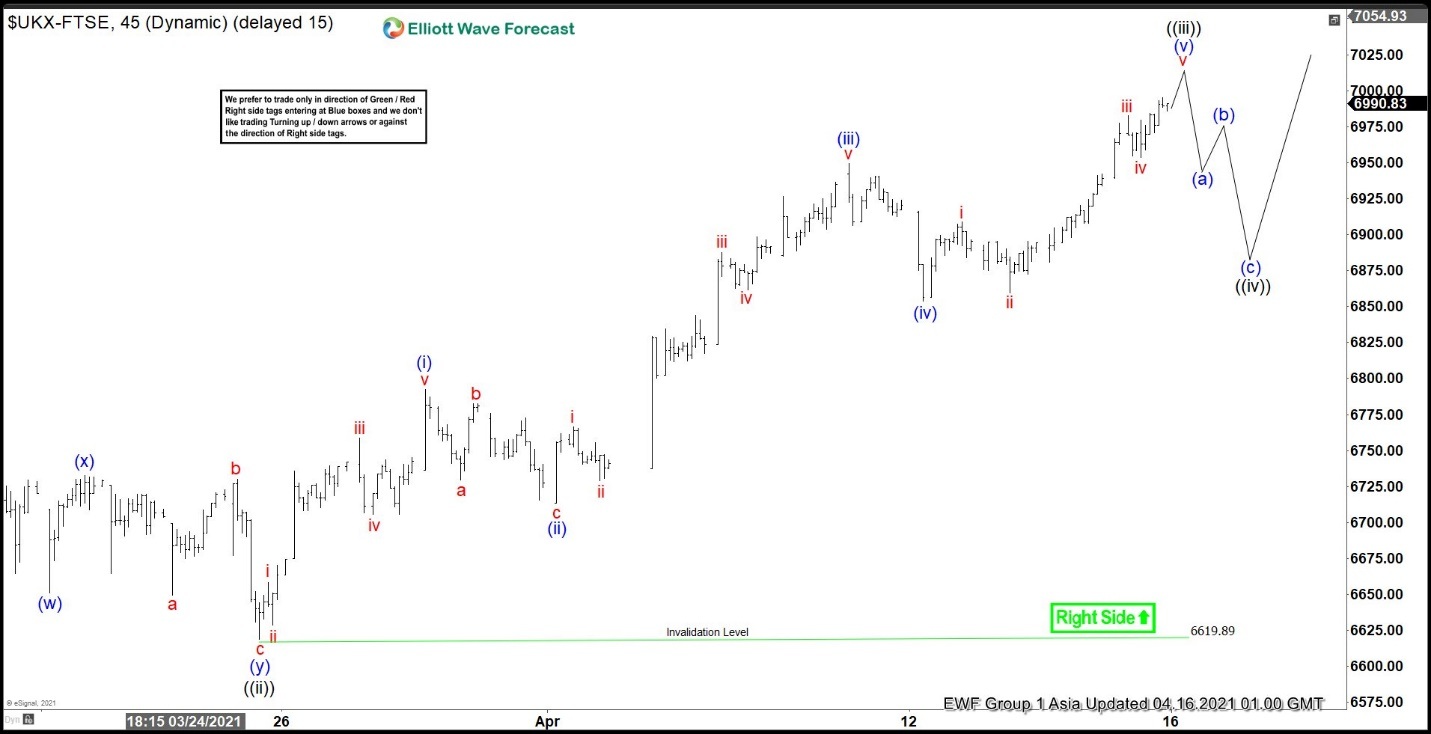
Short term Elliott wave view in FTSE Index suggests that the rally from February 27 is unfolding as a 5 waves impulse Elliott Wave structure. Up from February 27 low, wave ((i)) ended at 6812.78 and pullback in wave ((ii)) ended at 6619.89. Index has resumed higher in wave ((iii)) with subdivision as another impulse in lesser degree. Up from wave ((ii)) low, wave (i) ended at 6792.23 and dips in wave (ii) ended at 6713.63. Index resumed higher in wave (iii) towards 6949.56 and pullback in wave (iv) ended at 6853.75.
Expect wave (v) to end soon which should complete wave ((iii)) in higher degree. Afterwards, Index should pullback in wave ((iv)) to correct the cycle from March 25 low before the rally resumes higher in wave ((v)). As far as March 25 pivot low at 6619.89 stays intact, expect dips to find support in 3, 7, or 11 swing for further upside. The pullback in wave ((iv)) in 3, 7, or 11 swing should ideally end at 23.6% – 38.2% Fibonacci retracement of wave ((iii)). This area can be measured once wave ((iii)) has ended and pullback has started.
FTSE 1 Hour Elliott Wave Chart


