
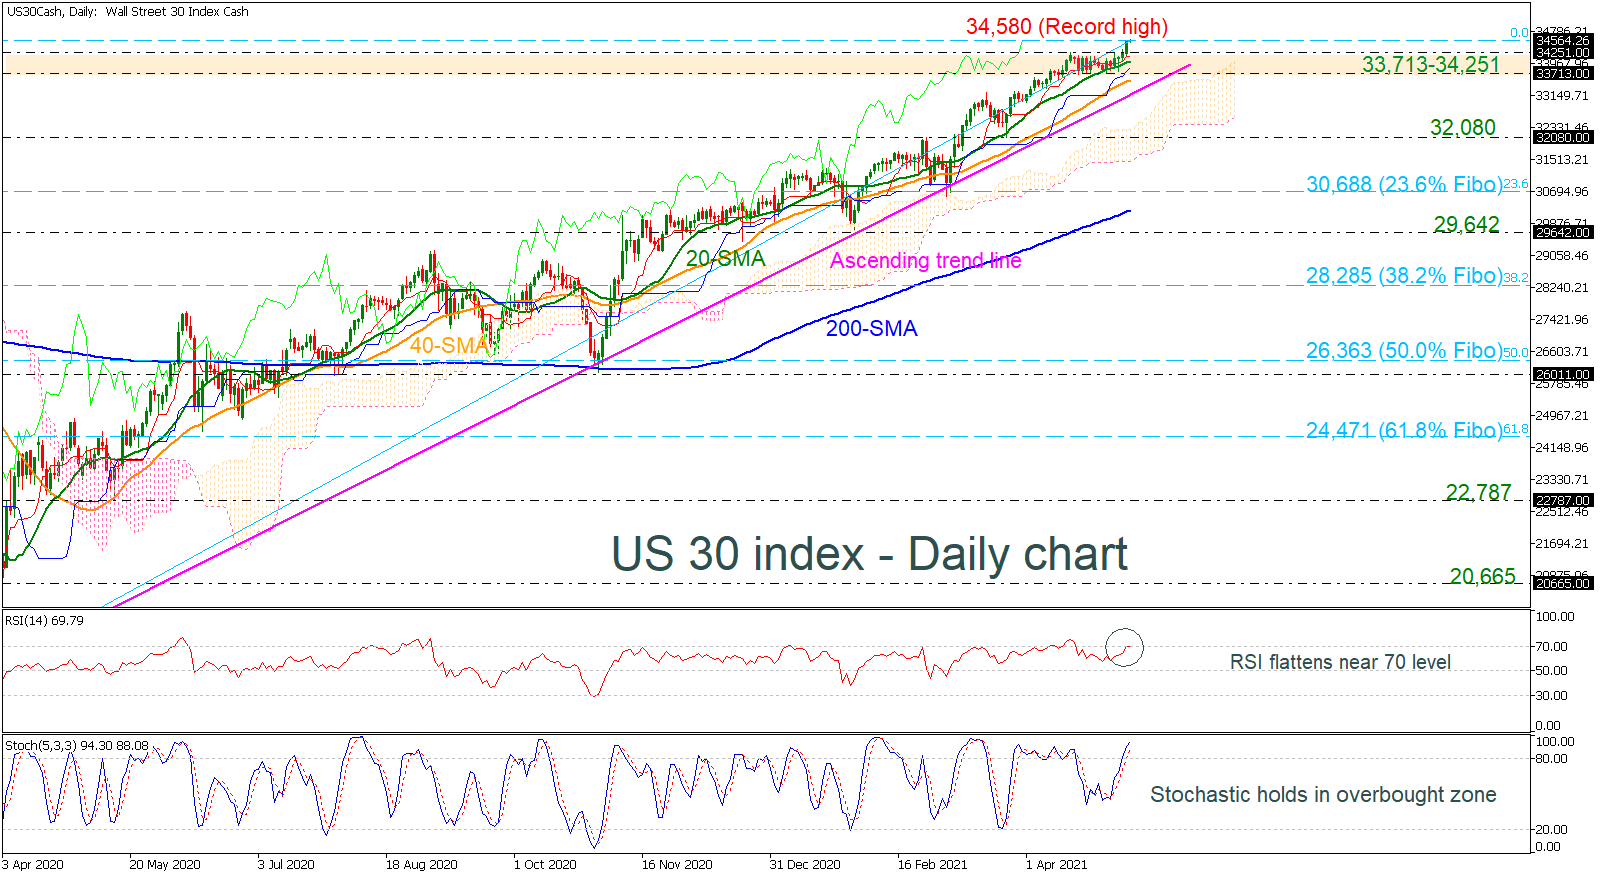
The US 30 index achieved a fresh all-time high around 34,580 earlier today after several days of sideways moves. Currently, the price is hovering near its opening level with the RSI confirming the flat momentum. Moreover, the stochastic oscillator is jumping in the overbought territory suggesting that the upside extension on price may come to an end.
If the index successfully jumps to uncharted levels, it may find a strong obstacle near the next psychological marks such as 35,000, 35,500 and 36,000.
In the negative scenario, the price may meet the 33,713-34,251 strong support zone ahead of the long-term ascending trend line, which stands near 33,360. The Ichimoku cloud also lies around the aforementioned level and any decreases below it could find support at 32,080. More declines could take the bears until the 23.6% Fibonacci retracement level of the up leg from 18,170-34,580 at 30,688.
Summarizing, the US 30 index has been creating higher highs and higher lows in the long-term timeframe, without any significant downside correction. However, a fall below the uptrend line and the 200-day SMA may change this outlook to bearish.


