
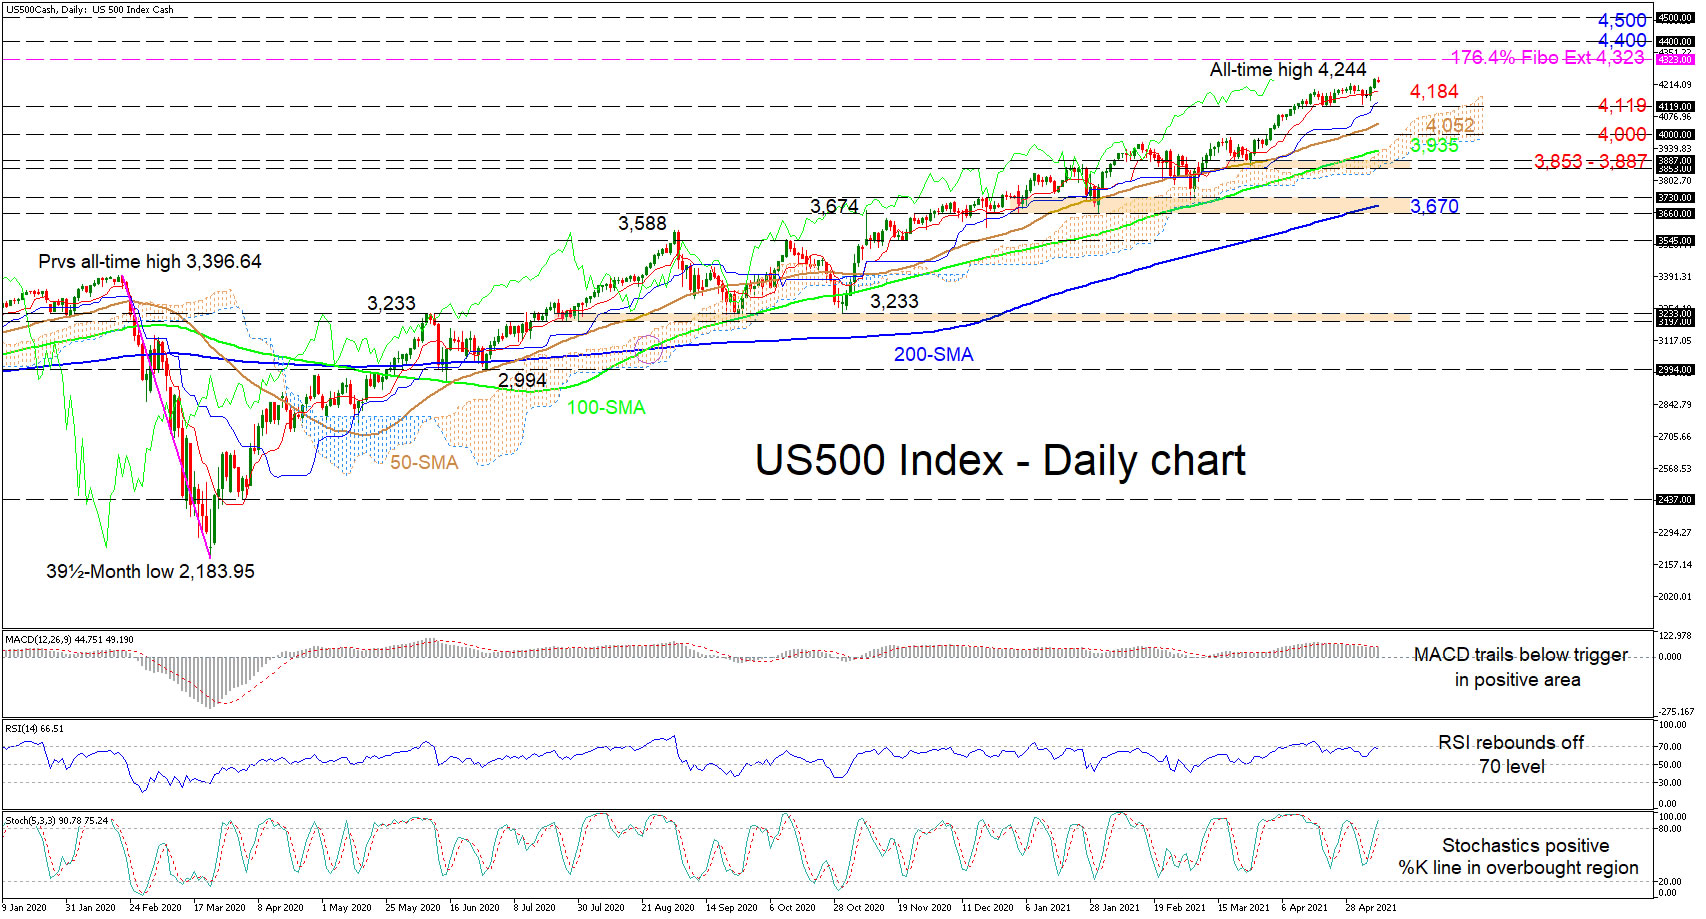
The US 500 stock index (Cash) has registered a fresh all-time high of 4,244 and is maintaining its’ decisive bullish tone, which is being shielded by the Ichimoku lines. Moreover, the firm incline in the slopes of the simple moving averages (SMAs) provide a formidable buffer zone for sellers to overcome in order to shift the bias to the downside.
The short-term oscillators are transmitting mixed signals in directional sentiment, but the broader picture remains clearly bullish. The MACD is in the positive region but is hovering below its somewhat stabilized red trigger line, while the RSI is pointing downwards after deflecting off the 70 level. The positively charged stochastic oscillator is endorsing additional price gains as the %K line heads higher into overbought territory.
Maintaining the climb, traders’ primary focus could turn to the 4,323 barrier for initial resistance, which happens to be the 176.4% Fibonacci retracement of the down leg from 3,396 to 2,183. Should the index manage to nudge past this boundary, the price may then navigate for the 4,400 and 4,500 hurdles.
A retreat in the index could find initial downside friction from the red Tenkan-sen line at 4,184 until the 4,119 trough. Breaching this low, the 50-day SMA at 4,052 and the Ichimoku cloud may step into the spotlight ahead of the 4,000 mark. From here, a deeper decline could then meet the 100-day SMA at 3,935 before the support belt of 3,853-3,887 attempts to dismiss negative price tendencies.
Summarizing, the index is upholding a strong bullish bias above the SMAs but a break below 4,119 could produce a retracement to the vicinity of the Ichimoku cloud.


