
- GBP/USD is moving up again. Can the uptrend continue or will a reversal finally take place? This Elliott Wave analysis will explain why a reversal seems to have better odd.
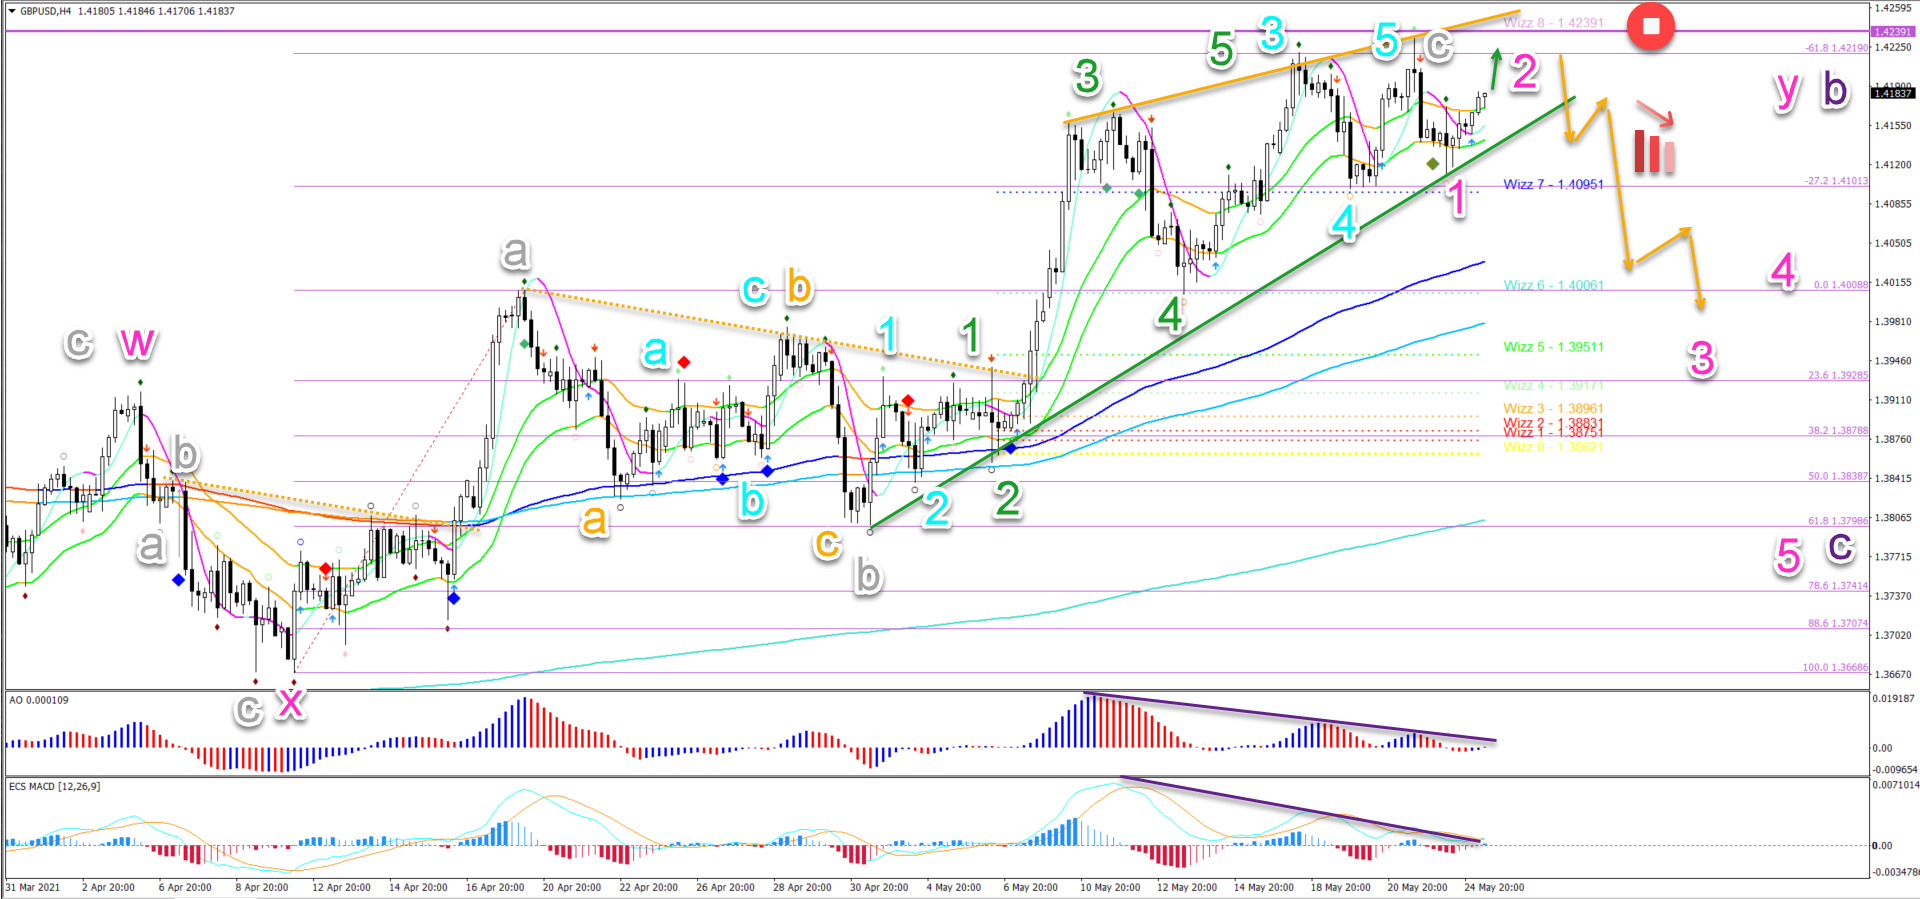
- The GBP/USD is testing the previous daily top (purple), which is a strong resistance zone. It has reached the -61.8% Fibonacci and Wizz 8 level, which is a key target zone.
- The GBP/USD chart offers multiple factors that make a bearish reversal more likely. Of course, any reversal analysis is always more risky because trends tend to be strong and continue.
Price charts and technical analysis
The GBP/USD chart offers multiple factors that make a bearish reversal more likely. Of course, any reversal analysis is always more risky because trends tend to be strong and continue. But here are the main factors in our eyes:
- The GBP/USD is testing the previous daily top (purple), which is a strong resistance zone.
- The GBP/USD has reached the -61.8% Fibonacci target and Wizz 8 level, which is a key target zone.
- A wave C (grey) usually bounces at the -61.8% Fib target. A break above this target could indicate a wave 3 rather than a wave C.
- A rising wedge reversal chart pattern seems to be also unfolding. The highs are much lower and the lows are higher.
- A divergence pattern is also visible (purple lines) on the oscillator, which indicates that the uptrend is losing steam.
- A bullish WXY (pink) complex correction seems to be finished. A bullish ABC (grey) pattern seems to finish wave Y (pink).
- A break above the top invalidates (red circle) this bearish reversal.
- A break below (orange arrows) the support trend line (green) could confirm the reversal and a potential 123 (pink) wave pattern.
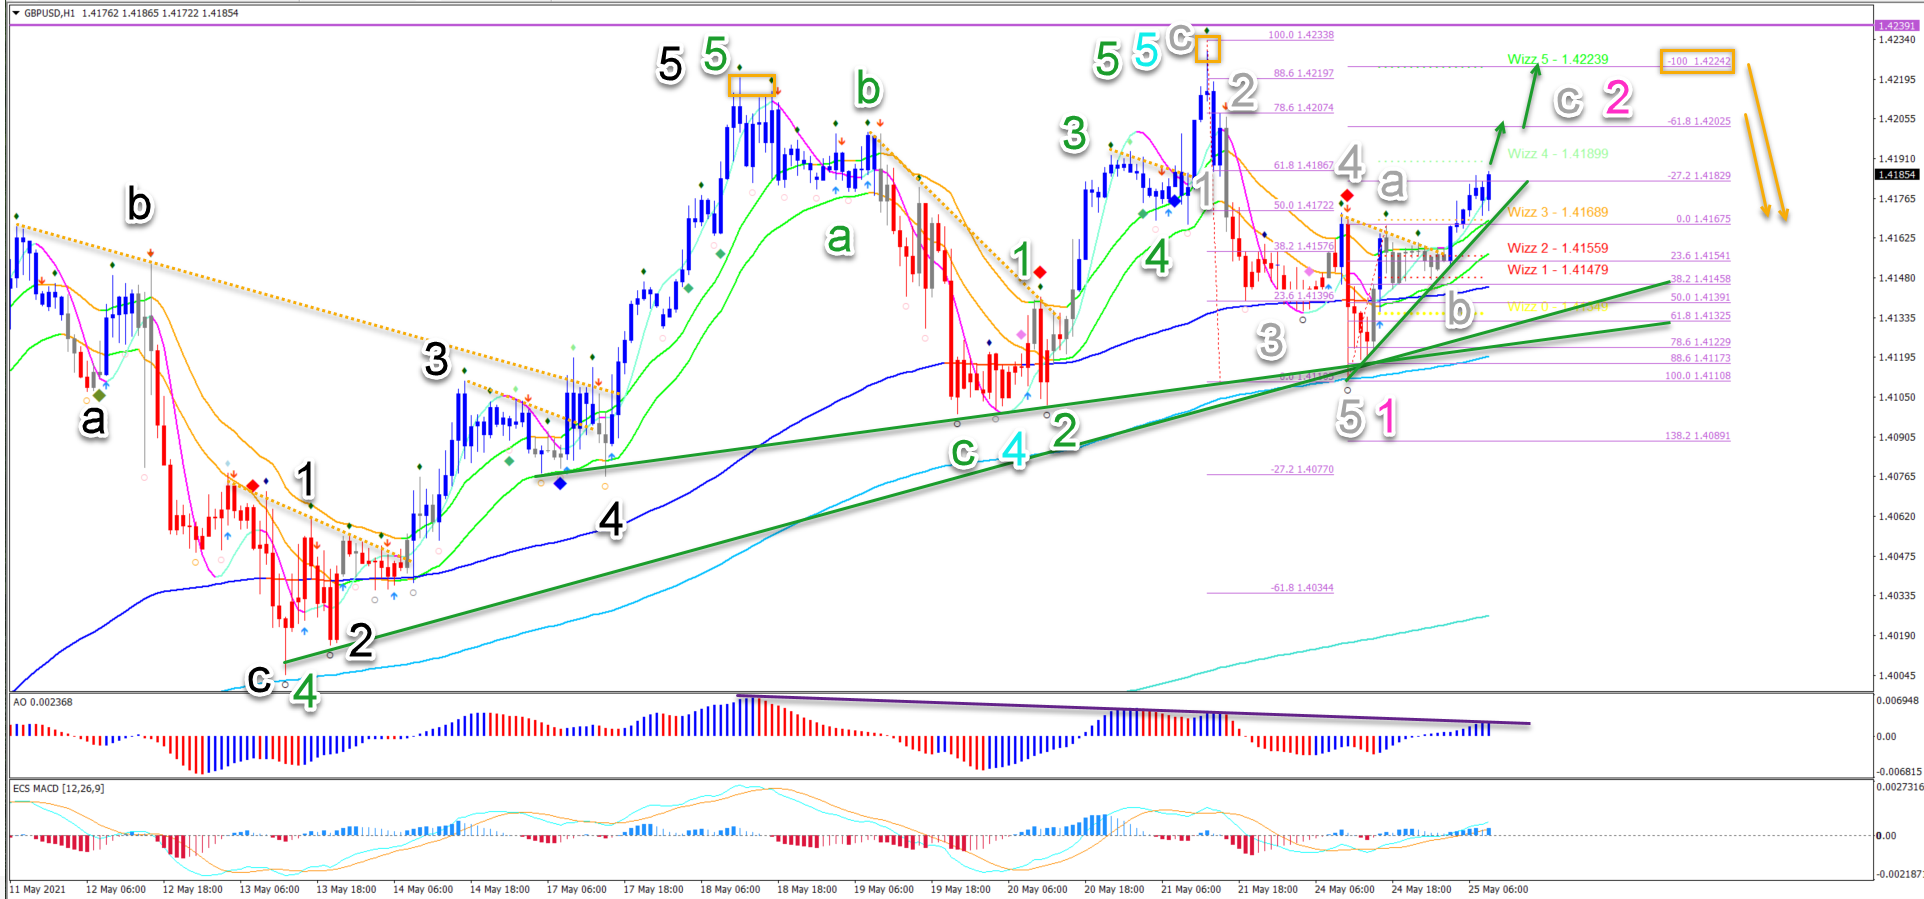
On the 1 hour chart, there is some indication of a reversal as well.
- Even if the top breaks by a small margin, it could still become a triple top or be part of the rising wedge. But not the bearish wave 12 (pink) that we are showing here.
- A bearish bounce (orange arrows) could confirm a head and shoulders reversal chart pattern.
- A 5 wave pattern (grey) could complete wave 1 (pink).
- A bullish ABC (grey) could complete wave 2 (pink).
- A breakout below the 21 ema zone and the 144 – 233 ema zone could confirm the revers.


