
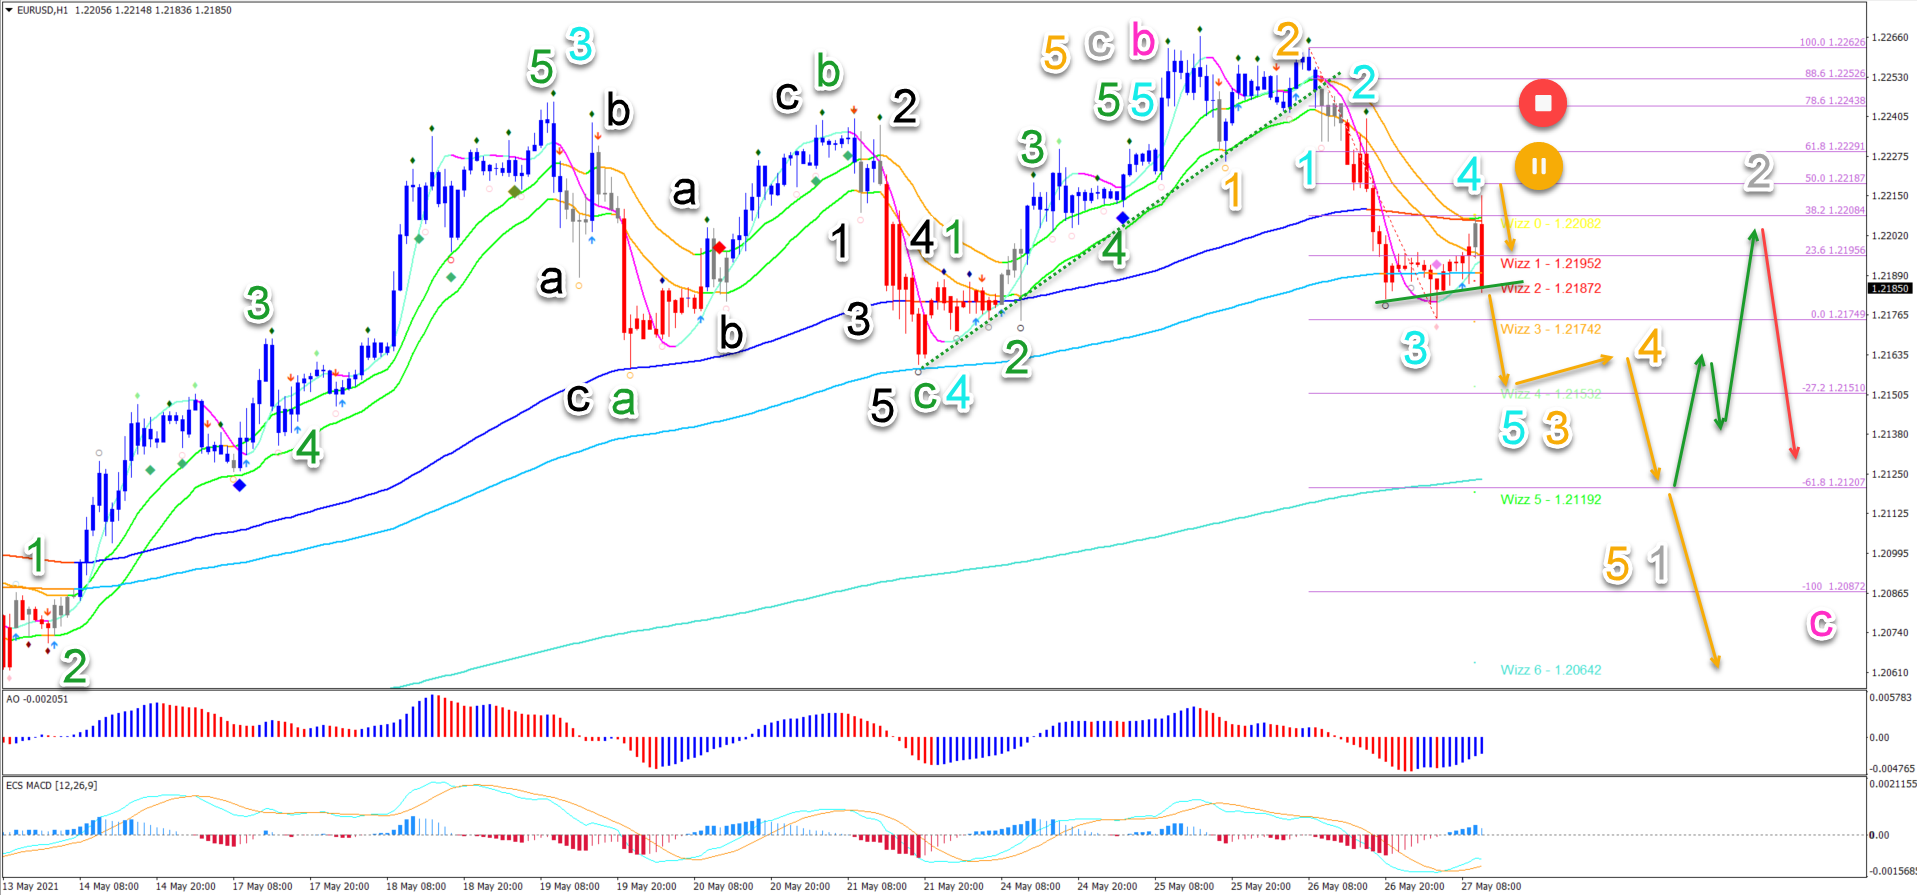
- On the 1 hour chart, price action broke the 21 ema zone and support trend line (dotted green) as a confirmation of the reversal, as mentioned in our EUR/USD video
- The EUR/USD bearish action seems to complete a bullish wave C (grey) in a bearish wave B (pink). A bearish reversal is therefore expected, let’s look at all of the angles
- Will the EUR/USD also make a larger bearish reversal or is the uptrend still active? Let’s review the Elliott Wave patterns.
The EUR/USD is testing the previous top (red box). Price action made a bearish bounce at the Wizz 8 target zone as expected.
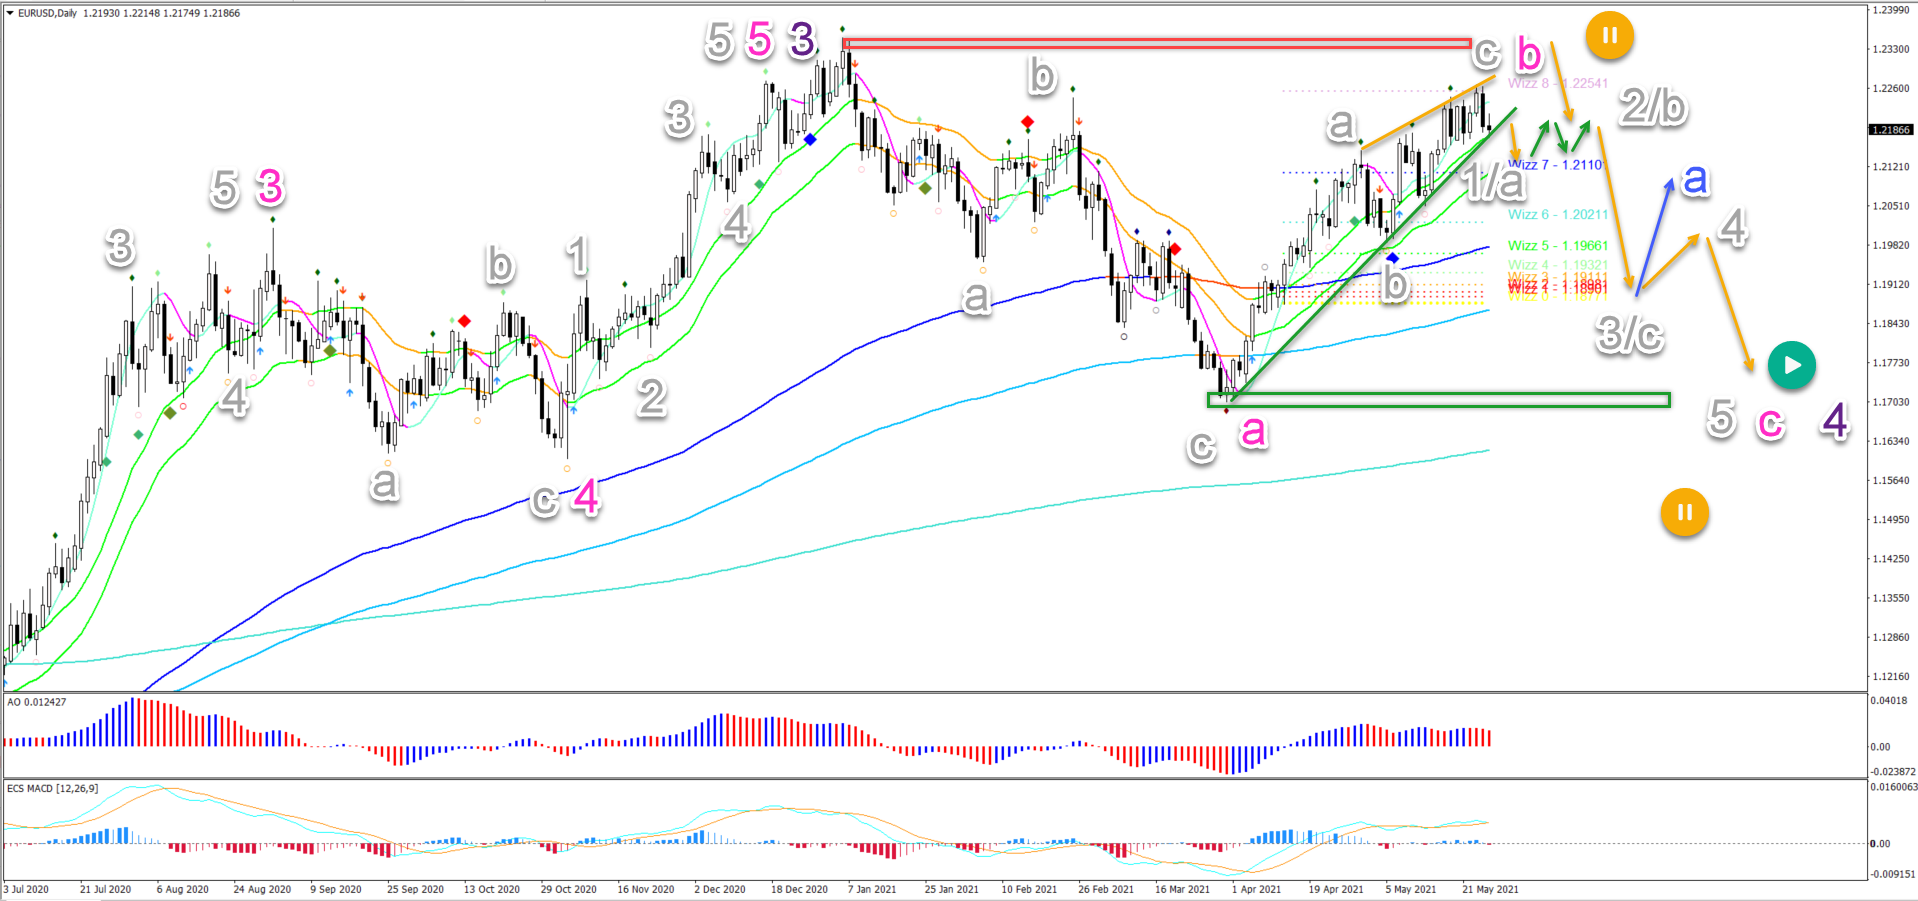
- The EUR/USD bearish action seems to complete a bullish wave C (grey) in a bearish wave B (pink). A bearish reversal is therefore expected, let’s look at all of the angles:
- A rising wedge reversal chart pattern is visible (trend lines). A break below the support (green) line and the 21 ema zone would confirm the reversal.
- A bearish breakout could start the wave C (pink) correction in wave 4 (purple). Either a 3 wave ABC in a larger ABCDE triangle (pink) or 5 wave pattern in a larger ABC flat (pink) is expected.
- If price action does move up higher, then another bearish bounce (orange arrow) is expected at the previous high (red box).
- Only a significant break above the high places this wave outlook on hold (orange circle). A strong break below the bottom (green box) also makes the current wave outlook unlikely.
On the 1 hour chart, price action broke the 21 ema zone and support trend line (dotted green) as a confirmation of the reversal, as mentioned in our EUR/USD and GBP/USD video on Wednesday:
- The bearish reversal took place after price action completed an ABC (green) pattern in wave 4 (blue) before making a 5 wave (green) in wave 5 (blue).
- A bearish breakout confirms a larger bearish price swing after divergence patterns emerged on multiple time frames and a strong resistance zone was reached.
- The strong bearish impulse is probably some type of wave 3 (blue).
- The current pullback is expected to be a wave 4 (blue) as long as price action respects the Fibonacci retracement levels.
- A break above the 50% Fib (orange circle) however makes the current wave outlook less likely. A deep push up invalidates it (red circle). In that case, price action made a bearish ABC pattern rather than a 123.
- A break below the support could confirm the extension of the wave 3 (orange).
- The main targets are the Wizz 4, 5, and 6 levels and the Fibonacci targets.
- This could complete a wave 1 pattern (grey). A bullish ABC (green) pattern in wave 2 (grey) could emerge at these targets.


