
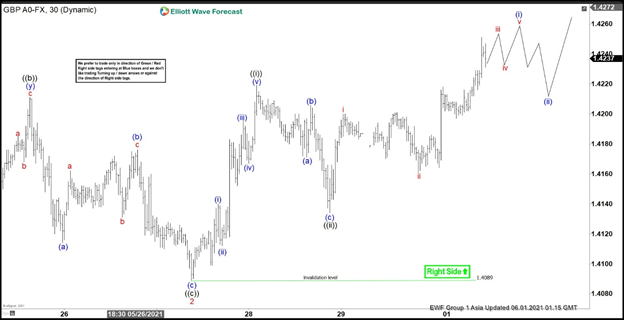
Short term Elliott Wave view in GBPUSD suggests that the rally from 4.12.2021 low unfolded as an impulse Elliott Wave structure. Up from April 12 low, wave 1 ended at 1.423 and wave 2 pullback ended at 1.4089. Internal subdivision of wave 2 unfolded as a zigzag Elliott Wave structure. Down from wave 1, wave ((a)) ended at 1.411 and wave ((b)) bounce ended at 1.4211. Pair then resumes lower in wave ((c)) which ended at 1.4089. This completed wave 2 in higher degree.
The pair has extended higher again in wave 3. Internal of wave 3 is unfolding as another impulse in lesser degree. Up from wave 2 low, wave (i) ended at 1.414 and pullback in wave (ii) ended at 1.4112. Wave (iii) ended at 1.4196, wave (iv) ended at 1.4167, and final leg higher wave (v) ended at 1.4219. This completed wave ((i)) in higher degree. Pullback in wave ((ii)) ended at 1.4134. Pair has resumed higher in wave ((iii)) and broken above wave 1 high at 1.423, suggesting the next leg higher has started. Near term, expect a few more highs to end wave (i) of ((iii)), then it should pullback in wave (ii) of ((iii)) before the rally resumes. As far as May 27 pivot at 1.4089 low remains intact, expect dips to find support in 3, 7, or 11 swing for further upside.
GBP/USD 30 minutes Elliott Wave chart


