
Elliott Wave view in USDJPY suggests the rally from April 23 low to 110.34 ended wave (2). The internal of wave (2) unfolded as a zigzag Elliott Wave structure. Up from April 23 low, wave A ended at .109.7, wave B ended at 108.31, and wave C ended at 110.34. Pair has turned lower in wave (3) but still needs to break below previous April 23 low at 107.45 to rule out a double correction.
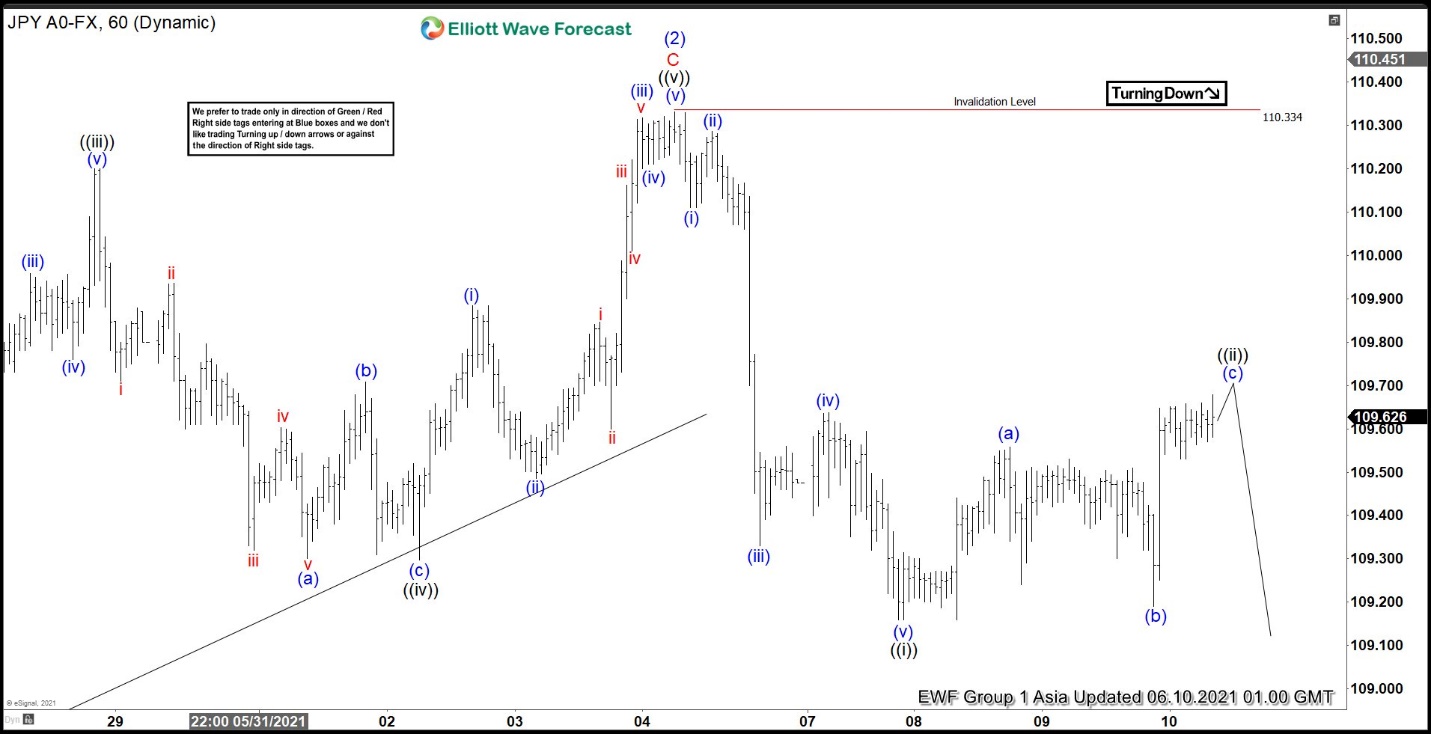
Short term structure of the decline from wave (2) peak looks impulsive, favoring further downside. Down from wave (2), wave (i) ended at 110.11 and bounce in wave (ii) ended at 110.28. Pair resumes lower again in wave (iii) towards 109.33 and wave (iv) bounce ended at 109.637. Final leg lower in wave (v) of ((i)) ended at 109.16. Wave ((ii)) rally is currently in progress to correct cycle from June 4 high before the decline resumes.
Up from wave ((i)), wave (a) ended at 109.55 and pullback in wave (b) ended at 109.19. Wave (c) is expected to end soon at the 100% – 161.8% fibonacci extension of wave (a) at 109.58 – 109.83. From this area, pair can extend lower again. As far as pivot at 110.33 high stays intact, expect rally to fail and pair to extend lower.
USDJPY 60 Minutes Elliott Wave Chart


