
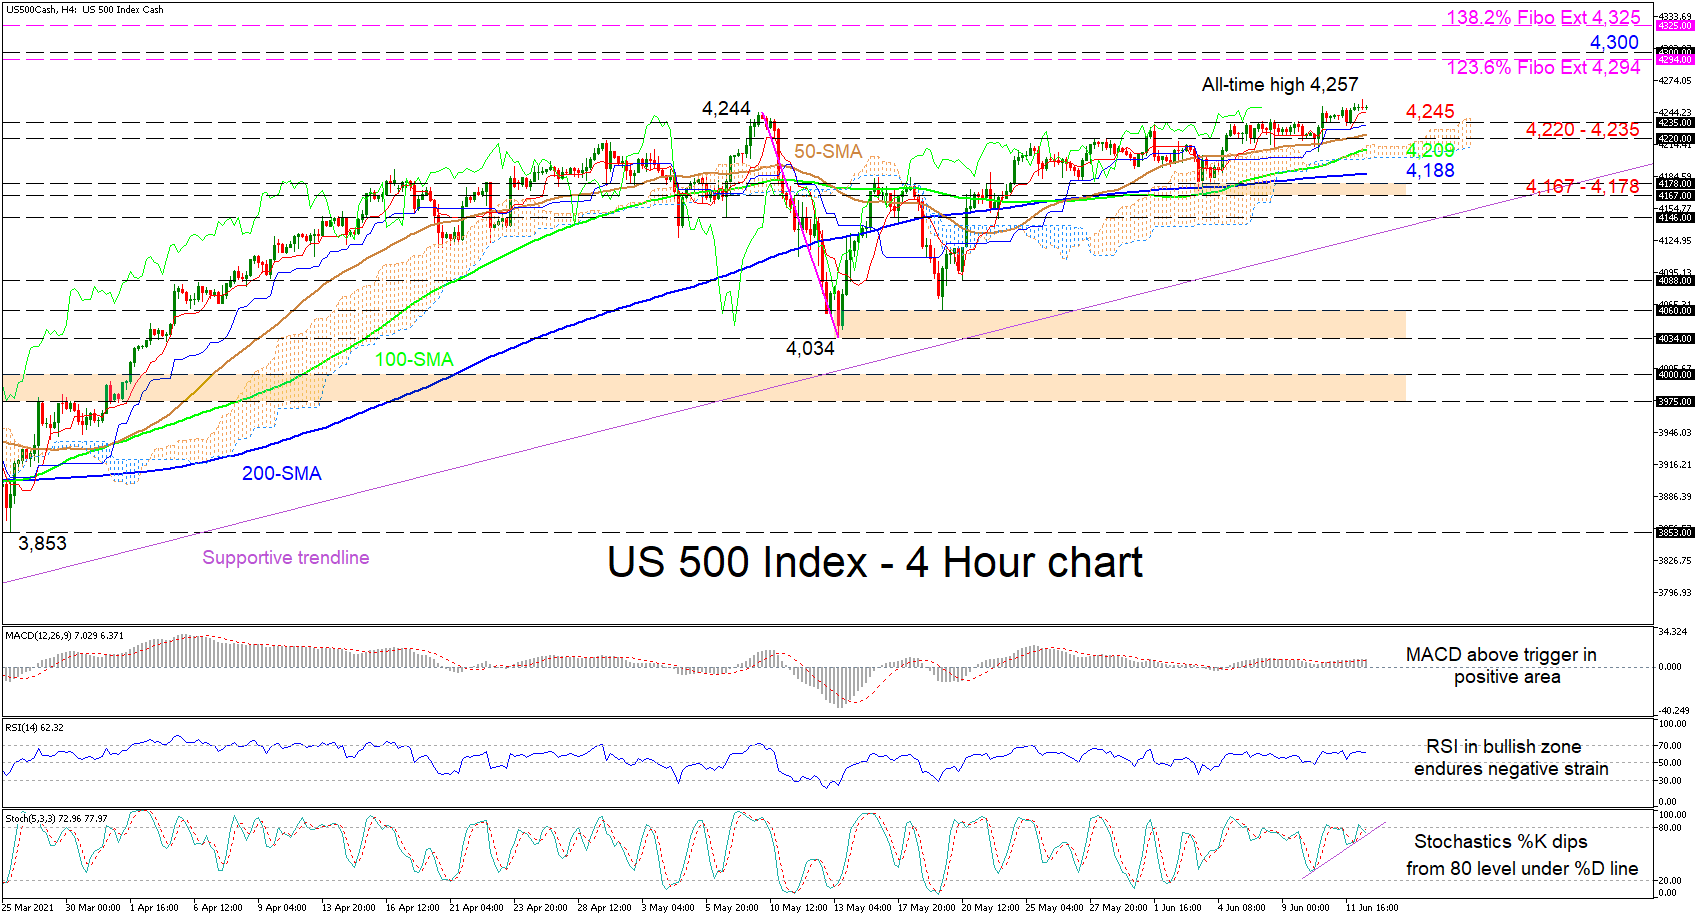
The US 500 stock index (Cash) is poised to move higher after having registered a fresh all-time high of 4,257. The 50- and 100-period simple moving averages (SMAs) are regaining their positive incline, sponsoring strengthening sentiment in the index.
The Ichimoku lines are endorsing positive price action, while the short-term oscillators’ bullish signals appear to be under strain. The MACD is holding above its static red trigger line, while the RSI is struggling to steer higher in bullish territory. Although the stochastic oscillator has turned bearish, promoting a price pullback in the index, this has yet to look certain.
If the index continues to climb, first resistance could transpire from the 4,294 level, which happens to be the 123.6% Fibonacci extension of the down leg from 4,244 until 4,034, and the 4,300 hurdle overhead. Overcoming these congested boundaries, the bulls may then propel the index towards the 138.2% Fibo extension of 4,325.
Otherwise, if sellers gain control, quick downside constraints could arise from the red Tenkan-sen line at 4,245 ahead of the support zone of 4,220-4,235. Dipping below this cluster of support barriers, the price may then meet the cloud and the 100-period SMA around 4,209. Sinking beneath the cloud, sellers may then target the 200-period SMA at 4,188 and the adjoining support base of 4,167-4,178.
Summarizing, the US 500 index is sustaining a bullish bearing above the SMAs and the Ichimoku cloud. Yet, a pullback in the price below the 4,167 trough and the supportive trend line – pulled from 3,233 – could see negative pressures recapture an edge.


