
- Dow Jones Index (US30) has been taking a few weeks break since its last high. But the consolidation zone is simply going sideways, which is a bullish signal.
- A break above the 21 ema high could confirm a bullish breakout and the end of the wave 4 and start of wave 5. The main targets are $36,600 and $38,000.
Price charts and technical analysis
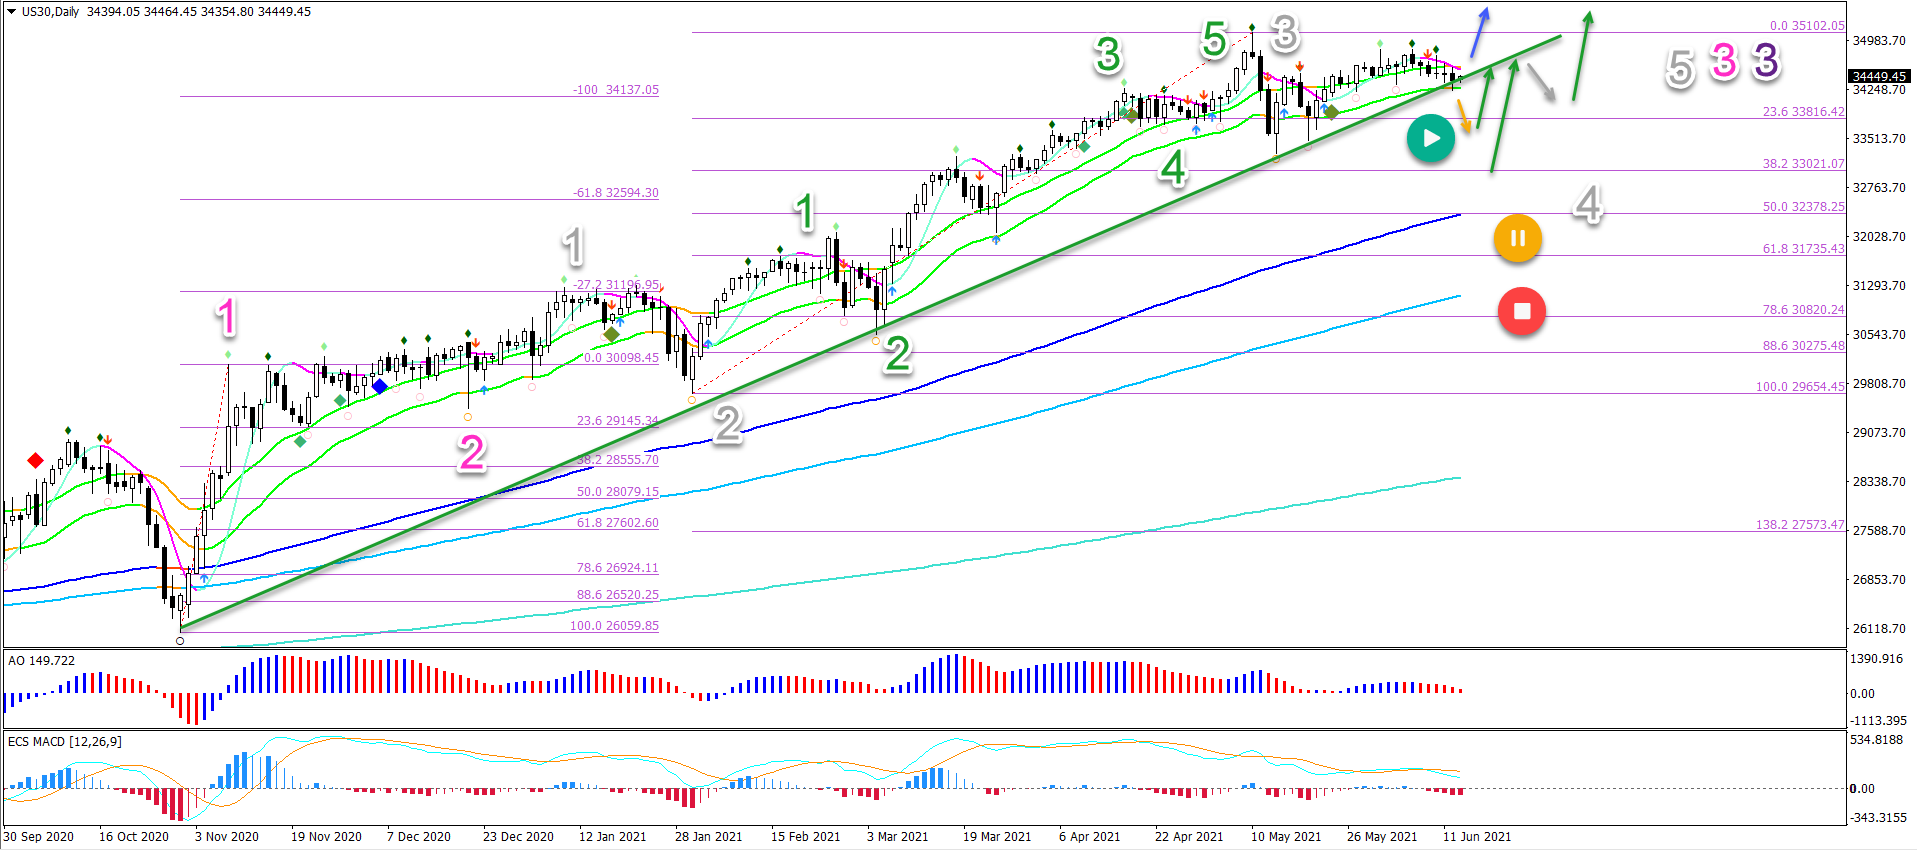
The US30 daily chart has been in a strong uptrend. All of the moving averages are neatly aligned with lots of space in between. This indicates a strong momentum and trend:
- The bullish price swing is therefore likely some type of wave 3 (grey).
- Considering the overall uptrend strength, the wave 3 is probably a wave 3 on a higher degree (pink/purple).
- The current sideways consolidation fits well within the expected wave 4 (grey) pattern.
- A break above the 21 ema high could confirm a bullish breakout (blue arrow) and the end of the wave 4 and start of wave 5 (grey).
- A break below the support trend line (green) and 21 ema low could indicate a pullback (orange arrow).
- The pullback will test the previous low or 38.2% Fibonacci level where a bullish bounce is expected (green arrows).
- A deeper pullback places the wave 4 (grey) on hold (orange circle) and a very deep retracement invalidates it (red circle).
- The main targets are $36,600 and $38,000.
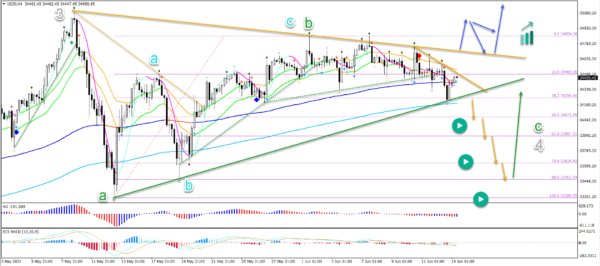
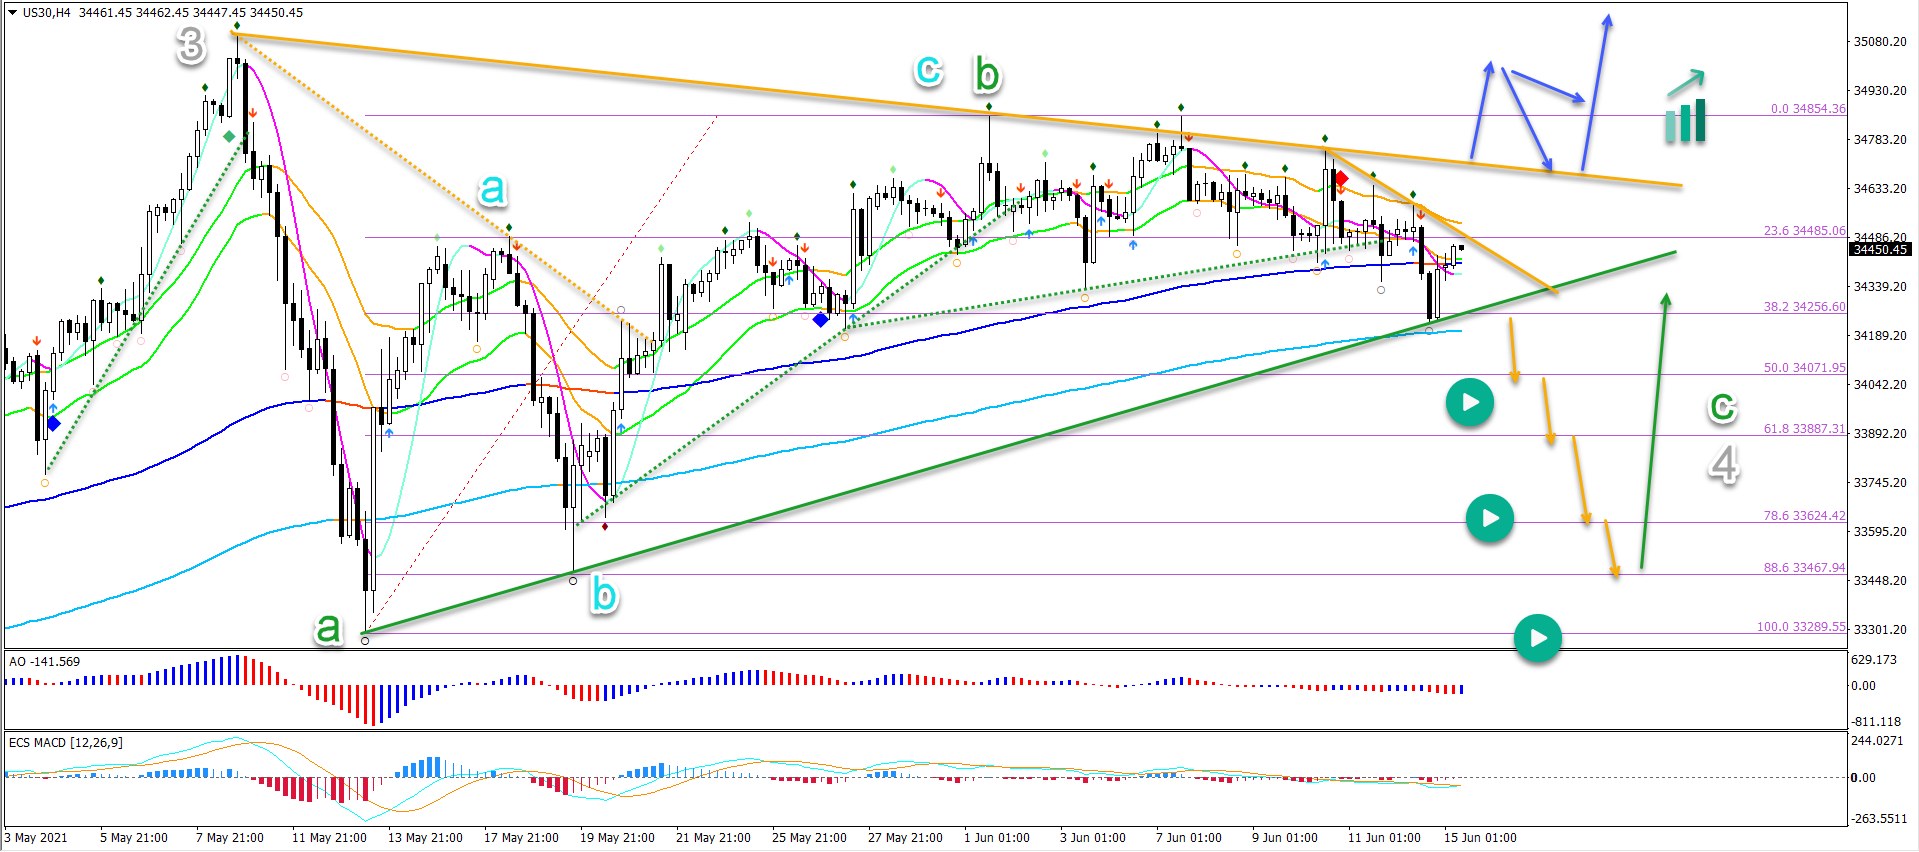
On the 4 hour chart, price action is testing the long-term moving averages:
- A bearish breakout (orange arrows) could indicate a deeper wave C (green) within wave 4 (grey).
- The main targets for the bearish wave C (green) are the Fibonacci levels where a bullish bounce could take place (green arrow).
- A bullish breakout (blue arrows) could indicate an immediate uptrend continuation.


 Favors Upside")

